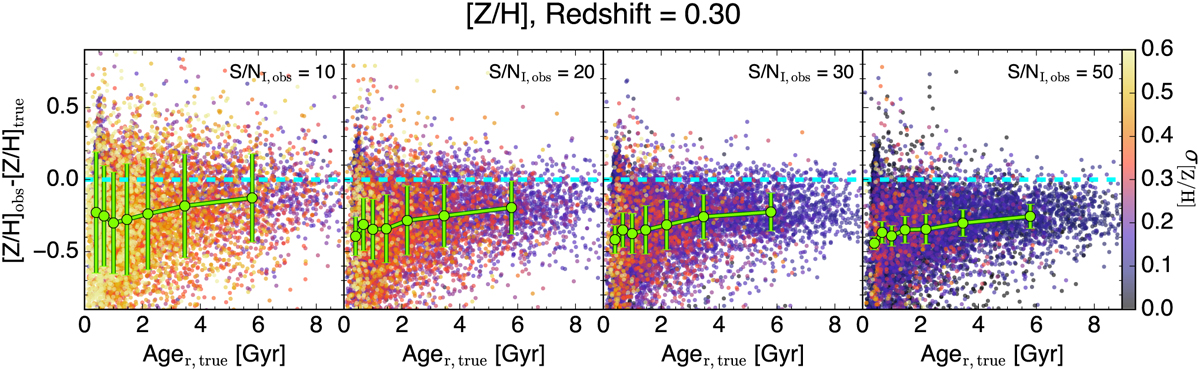
Fig. A.1
Download original image
Difference between the observed and true metallicity, as a function of true r-band light-weighted age values at z = 0.30, considering α-enhanced simulations. Each dot is colour-coded according to σ[zm] obtained from the posterior. The green error bars are the median and the 68% confidence interval of [Z/H] differences in bins of Ager,true, with each bin having the same number of data points. The cyan dashed line represents the 0 value of the y-axis.
Current usage metrics show cumulative count of Article Views (full-text article views including HTML views, PDF and ePub downloads, according to the available data) and Abstracts Views on Vision4Press platform.
Data correspond to usage on the plateform after 2015. The current usage metrics is available 48-96 hours after online publication and is updated daily on week days.
Initial download of the metrics may take a while.