Fig. 13
Download original image
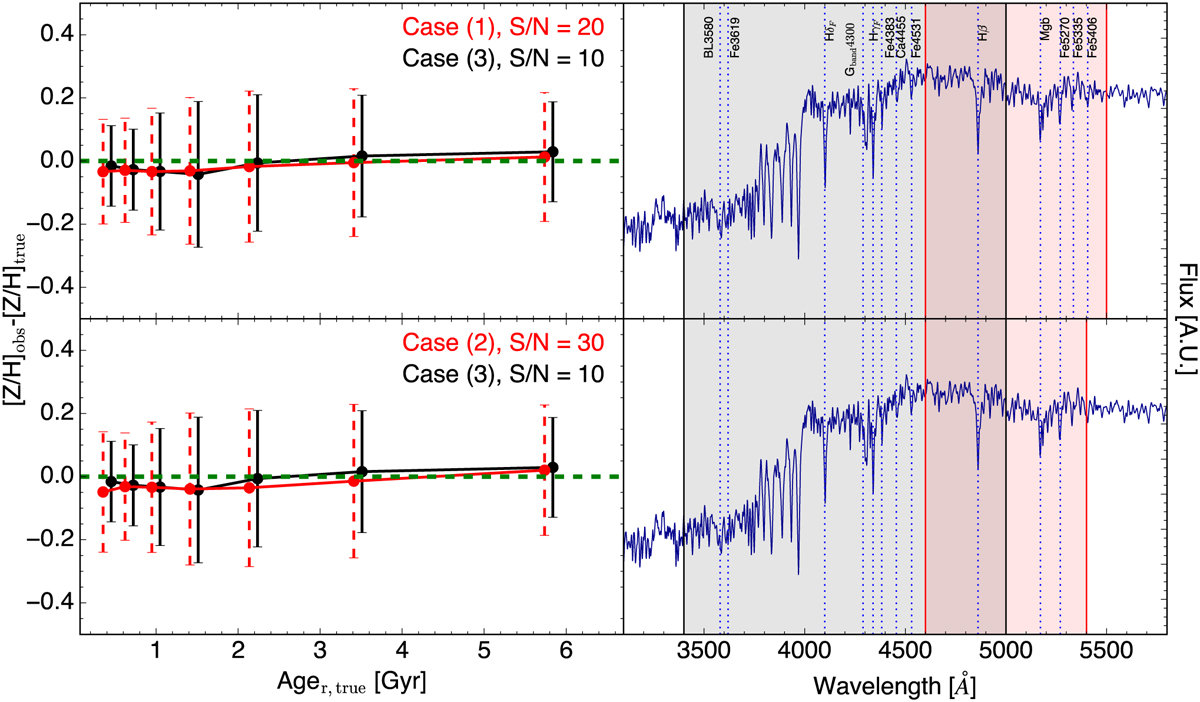
Median values of the difference between observed and true metallicity as a function of true r-band light-weighted age values. In both left panels, black error bars denotes case 3 ([BL3580, Fe3619, HδF, HγF, Gband4300, Fe4383, Ca4455, Fe4531, Hβ]) at S /N = 10, while the red dashed error bars indicates case 1 ([Hβ, Mgb, Fe5270, Fe5335, Fe5406]) at S /N = 20 (upper left panel) and case 2 ([Hβ, Mgb, Fe5270]) at S /N = 30 (lower left panel). The green dashed line in the left panels represents the 0 value of the y-axis. The blue curves in the right panels represent an example of a rest-frame template with 3 Gyr and solar metallicity. The black filled zone is the spectral range considered in case 3, while the red filled zone marks the spectral range considered in cases 1 and 2 (upper right and lower right panels, respectively).
Current usage metrics show cumulative count of Article Views (full-text article views including HTML views, PDF and ePub downloads, according to the available data) and Abstracts Views on Vision4Press platform.
Data correspond to usage on the plateform after 2015. The current usage metrics is available 48-96 hours after online publication and is updated daily on week days.
Initial download of the metrics may take a while.