Fig. 1
Download original image
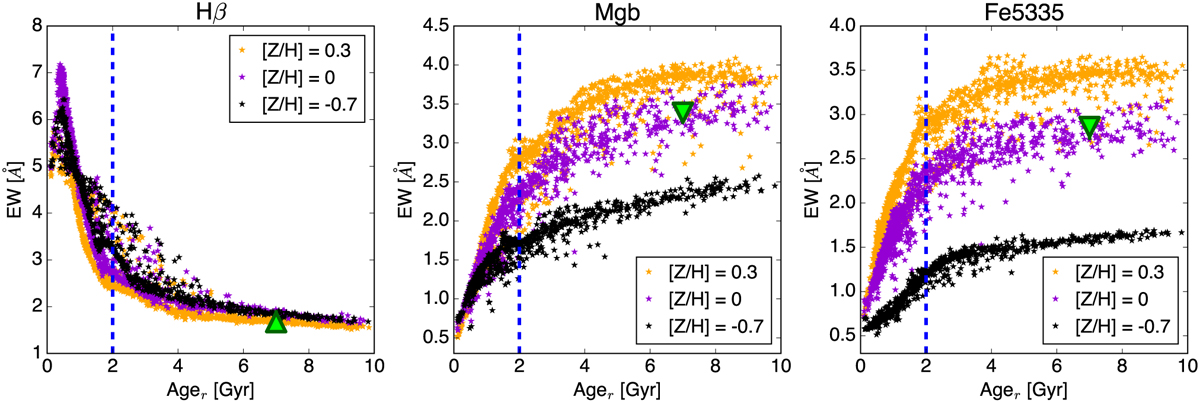
Distribution of Hβ (left panel), Mgb (middle panel) and Fe5335 (right panel) values as a function of the r-band light-weighted age in three different bins of mass-weighted [Z/H]: 0.3 (orange symbols), 0 (purple symbols), and −0.7 (black symbols), respectively, as measured in our template library (excluding templates with secondary bursts). The green arrow represents the effect on the indices of a 0.1% fraction of a young (70 Myr) stellar population superimposed on a population with 7 Gyr, both with a solar metallicity.
Current usage metrics show cumulative count of Article Views (full-text article views including HTML views, PDF and ePub downloads, according to the available data) and Abstracts Views on Vision4Press platform.
Data correspond to usage on the plateform after 2015. The current usage metrics is available 48-96 hours after online publication and is updated daily on week days.
Initial download of the metrics may take a while.