Open Access
Fig. A.1.
Download original image
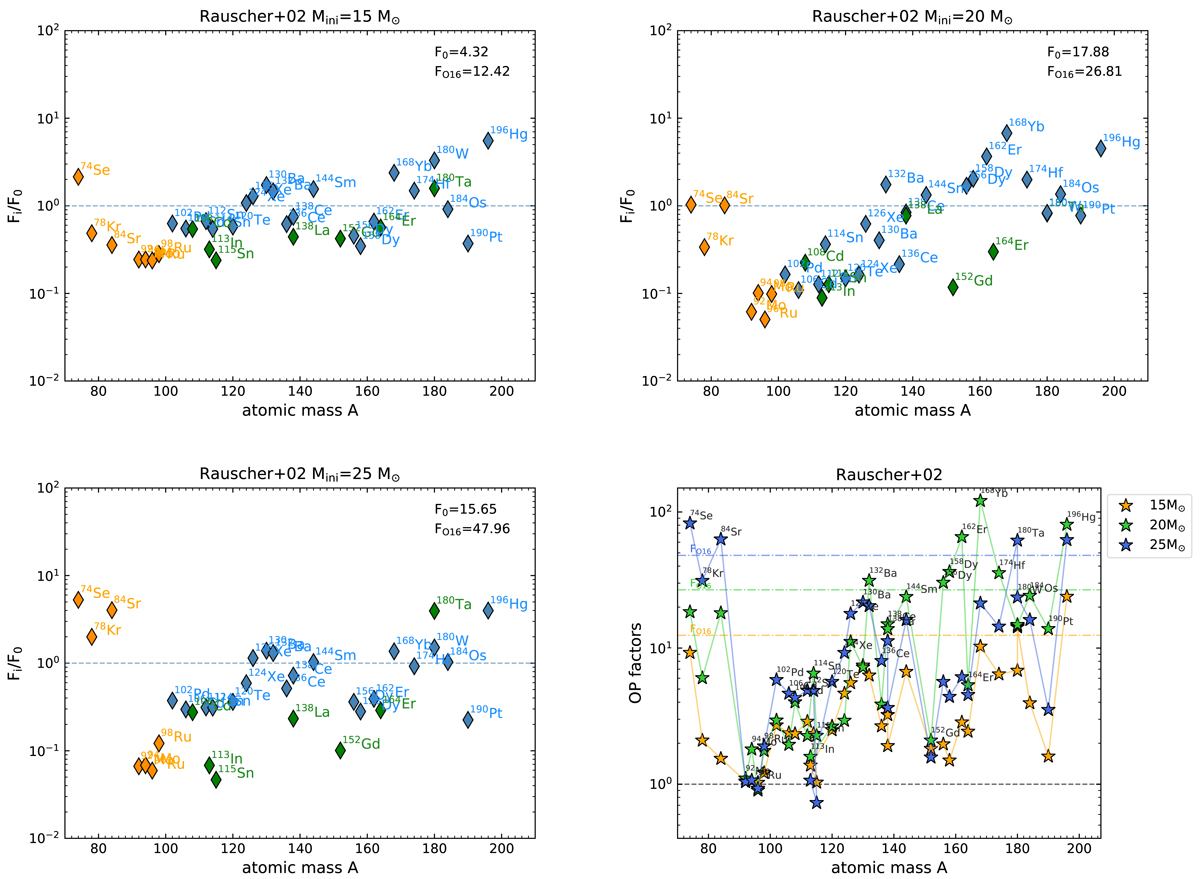
The Fi/F0 of the 15 M⊙ (upper left), 20 M⊙ (upper right), and 25 M⊙ (lower left) progenitors and the isotopic OP factor distributions (lower right) for Rauscher et al. (2002) models. The horizontal dotted-dashed lines in the lower right panel represent the FO16 in the 15 (yellow), 20 (green), and 25 M⊙ models (blue).
Current usage metrics show cumulative count of Article Views (full-text article views including HTML views, PDF and ePub downloads, according to the available data) and Abstracts Views on Vision4Press platform.
Data correspond to usage on the plateform after 2015. The current usage metrics is available 48-96 hours after online publication and is updated daily on week days.
Initial download of the metrics may take a while.