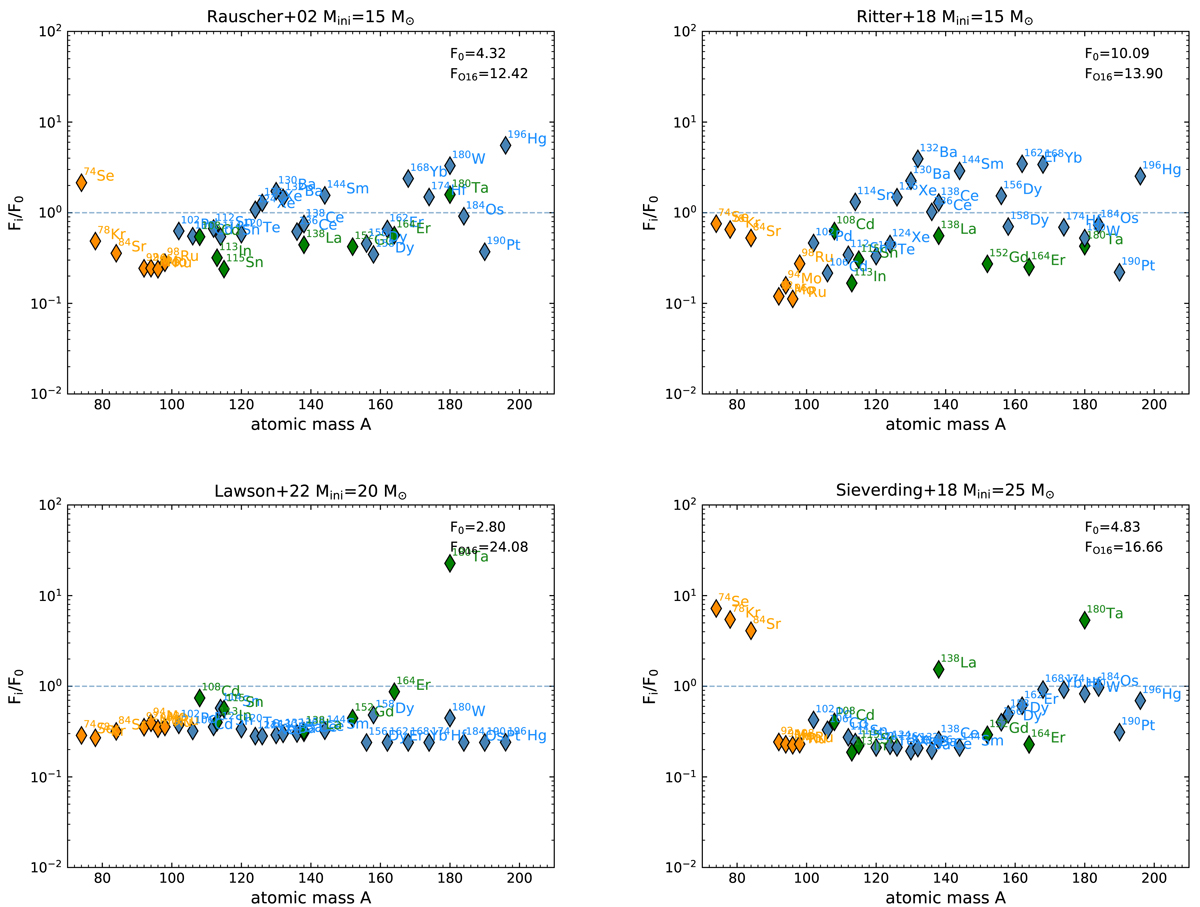
Fig. 1.
Download original image
p-nuclide overproduction factors divided by their average (Eq. (1)), the value of which is indicated in the top right of each panel, together with the OP factor for 16O (FO16) for comparison. The blue, orange, and green symbols respectively represent: (i) nuclei produced exclusively by the γ-process, (ii) nuclei that may have an additional explosive contribution; and (iii) nuclei that also have s-, r-process, or neutrino-capture contributions. Four examples of representative models are shown: the upper left panel is RAU15, a typical model; the upper right panel is RIT15, a case where the C–O shell merger occurs; the lower left panel is LAW20, a failed supernova; and the lower right panel is SIE25, a model where the F0 is the same as for the typical RAU15 model shown in the upper left panel, but where this value is driven by two isotopes produced by neutrino captures rather than by the p-nuclei produced exclusively by the γ-process (Sieverding et al. 2018). We note that in the two bottom panels a large number of p-nuclei – including the Mo and Ru isotopes – share the same Fi/F0 ≃ 0.2 − 0.3. However, as shown by the low F0, there is no significant production of these isotopes and their pattern only reflects the initial solar abundance distribution used in the models.
Current usage metrics show cumulative count of Article Views (full-text article views including HTML views, PDF and ePub downloads, according to the available data) and Abstracts Views on Vision4Press platform.
Data correspond to usage on the plateform after 2015. The current usage metrics is available 48-96 hours after online publication and is updated daily on week days.
Initial download of the metrics may take a while.