Fig. 12
Download original image
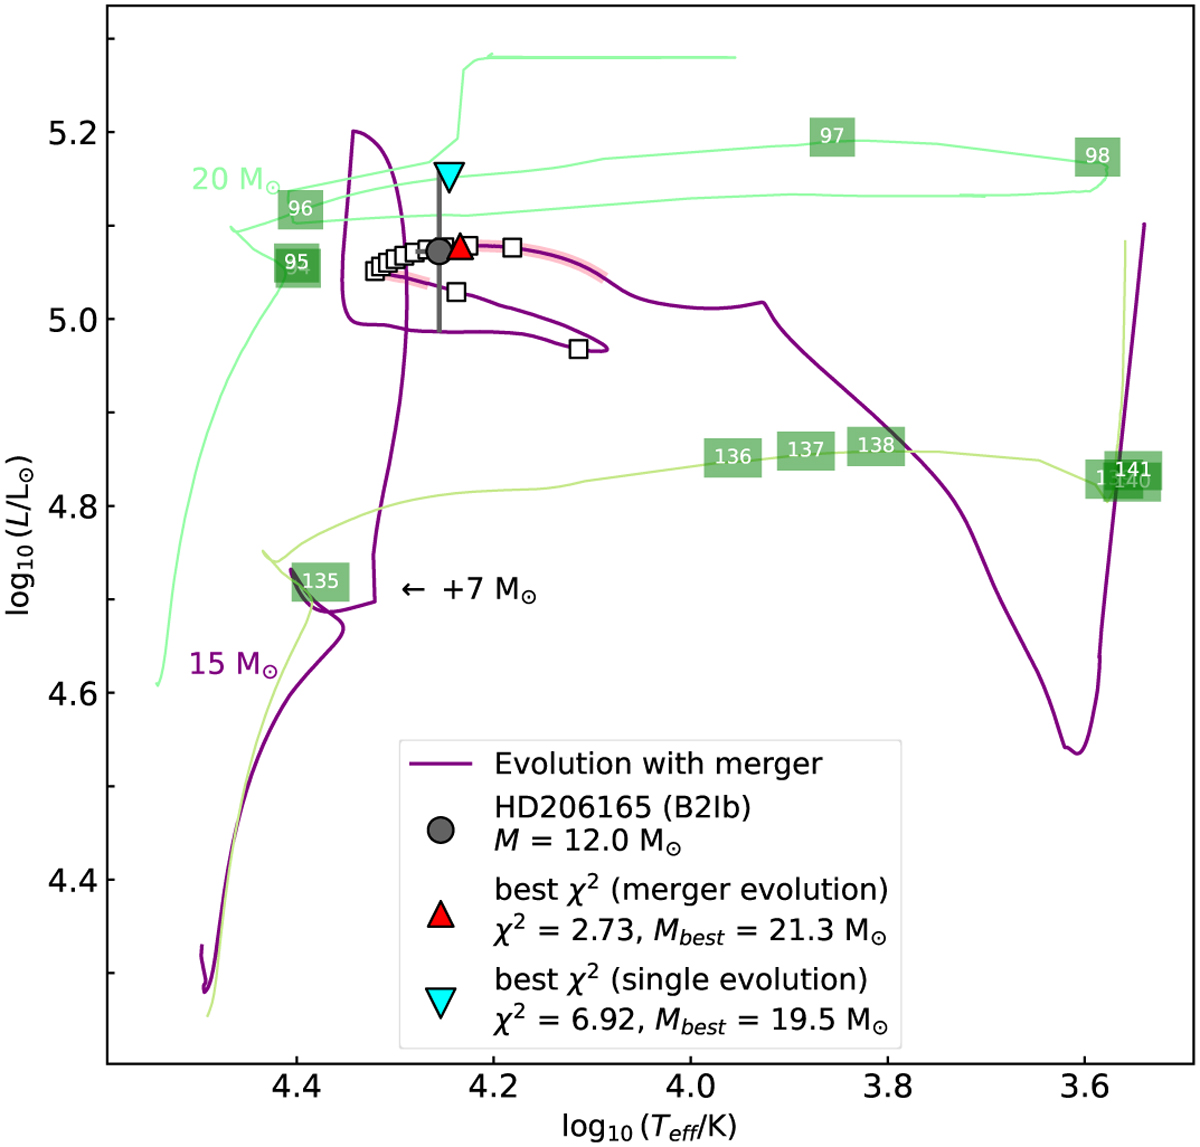
Comparison between single evolutionary tracks Ekström et al. (2012) and a MESA model with a merger (purple broader line) for HD206165. The squares with numbers are the ages in units of 105 yr for the Ekström et al. (2012) tracks while the white squares show the same time difference for the merged model. The shaded region in pink shows the core-He burning phase. The arrow indicates the point of the 15 M⊙ evolutionary track where the merging (mass addition of 7 M⊙) happened.
Current usage metrics show cumulative count of Article Views (full-text article views including HTML views, PDF and ePub downloads, according to the available data) and Abstracts Views on Vision4Press platform.
Data correspond to usage on the plateform after 2015. The current usage metrics is available 48-96 hours after online publication and is updated daily on week days.
Initial download of the metrics may take a while.