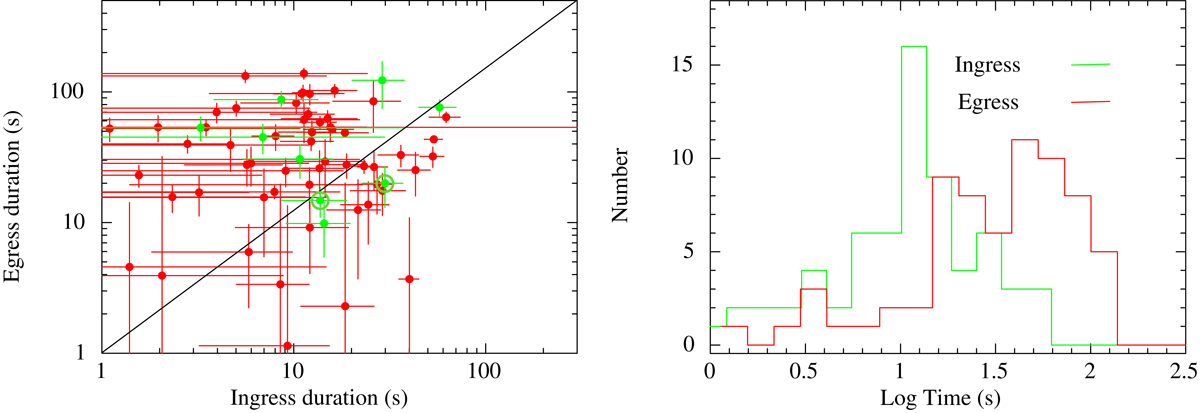
Fig. 8.
Download original image
Results of the statistical analysis of the X-ray mode switching timescales. Left: Duration of the low-to-high mode switch (egress) as a function of the duration of the high-to-low mode switch (ingress) computed using data from XMM-Newton/EPIC (in red) and NICER (green). The circled green points represent the values for the ingress associated with the two millimetre flares detected with ALMA and the subsequent egress. The solid black line indicates where the two quantities are equal. Right: Distribution of the low-mode ingress (in green) and egress (in red) times in logarithmic scale from XMM-Newton and NICER data.
Current usage metrics show cumulative count of Article Views (full-text article views including HTML views, PDF and ePub downloads, according to the available data) and Abstracts Views on Vision4Press platform.
Data correspond to usage on the plateform after 2015. The current usage metrics is available 48-96 hours after online publication and is updated daily on week days.
Initial download of the metrics may take a while.