Fig. 7.
Download original image
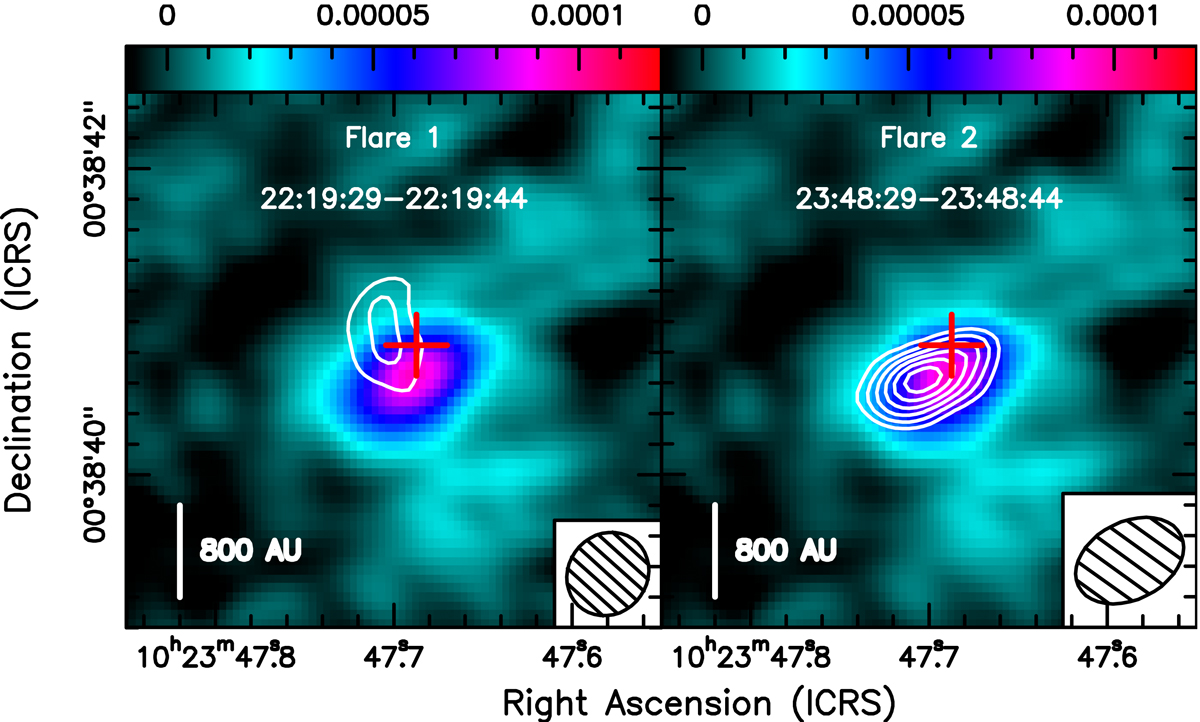
Contour levels for the millimetre emission detected during 15 s time intervals at the peak of Flare 1 (left panel) and Flare 2 (right panel) shown with solid white lines overlaid on the naturally weighted ALMA 3.1 mm image extracted using the whole integration time (colour scale). These contour levels start at 3σ and increase in steps of 1σ, where σ is the rms of the image, ∼90 μJy beam−1. Both panels display the same colour scale range in units of Jy beam−1. Time intervals (in UTC) are displayed at the top of each panel. The red cross depicts the radio position of J1023 (Deller et al. 2012). The synthesised beams, with extension 0.696″ × 0.540″ and position angle PA = −79.92° for Flare 1 and 0.931″ × 0.525″ and PA = −74.21° for Flare 2, are shown at the bottom-right corner of each panel.
Current usage metrics show cumulative count of Article Views (full-text article views including HTML views, PDF and ePub downloads, according to the available data) and Abstracts Views on Vision4Press platform.
Data correspond to usage on the plateform after 2015. The current usage metrics is available 48-96 hours after online publication and is updated daily on week days.
Initial download of the metrics may take a while.