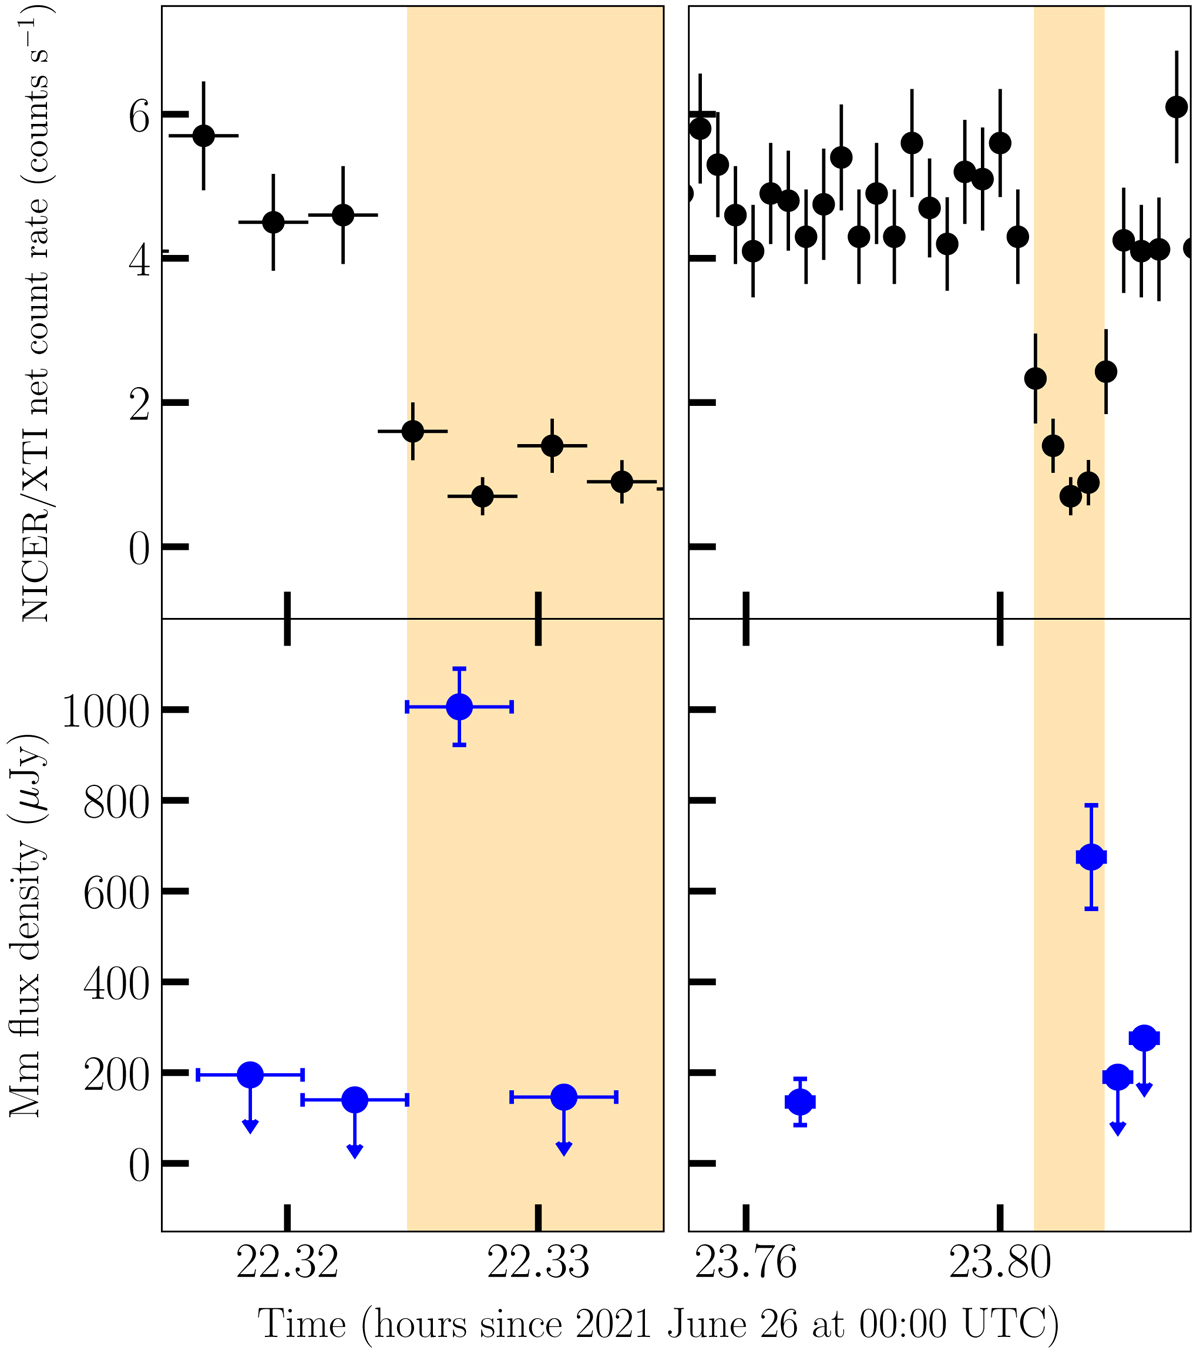
Fig. 6.
Download original image
X-ray (top) and millimetre (bottom) time series collected around the epochs when the two millimetre flares were detected. The X-ray light curve is binned at a time resolution of 10 s, and the millimetre light curve is binned at 15 s. Arrows indicate 3σ upper limits. Note the lack of coverage in the millimetre band for Flare 2 before and during the switch from the high to the low mode in the time interval between two consecutive ALMA scans. Note also the different scales on the horizontal axis in the panels on the left and on the right.
Current usage metrics show cumulative count of Article Views (full-text article views including HTML views, PDF and ePub downloads, according to the available data) and Abstracts Views on Vision4Press platform.
Data correspond to usage on the plateform after 2015. The current usage metrics is available 48-96 hours after online publication and is updated daily on week days.
Initial download of the metrics may take a while.