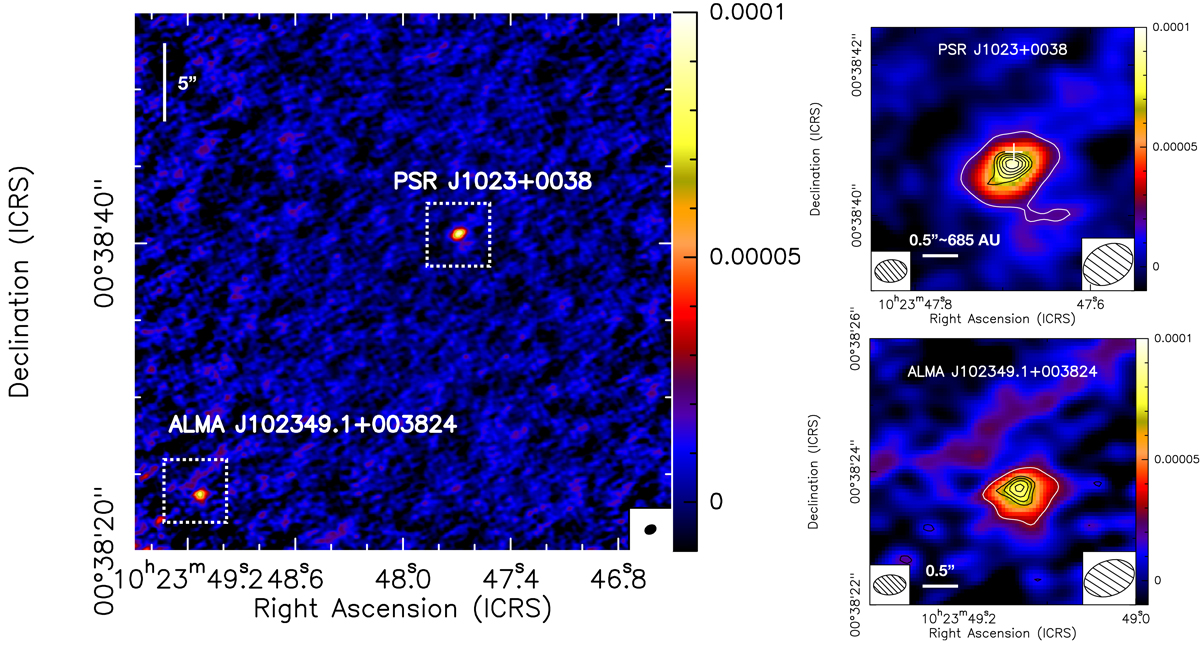
Fig. 5.
Download original image
ALMA images of the field around J1023. Left: ALMA 3.1 mm continuum image showing the two detected sources, J1023 and ALMA J102349.1+003824. The white dotted boxes display the FOV shown in the right panels. The ALMA synthesised beam (0.87″ × 0.53″, PA = −74.5°) is shown at the bottom-right corner. Right: Close-up images of J1023 (top) and ALMA J102349.1+003824 (bottom). In both panels, the colour scale corresponds to the image with natural weighting, with the 3σ contour indicated in white (σ values are listed in Table 2). The black contours are derived from the ALMA image obtained with robust=0. Contours range from 3σ to 9σ in steps of 1σ, where σ = 9.1 μJy beam−1 for J1023 and σ = 15 μJy beam−1 for ALMA J102349.1+003824. The white cross depicts the radio position of J1023 (Deller et al. 2012). A faint emission tail is detected at the 3σ level extending south-west of J1023. The synthesised beams for the robust=0 and natural images are displayed in the bottom-left and bottom-right corners, respectively (see Table 2). In all panels, the colour scale is in units of Jy beam−1.
Current usage metrics show cumulative count of Article Views (full-text article views including HTML views, PDF and ePub downloads, according to the available data) and Abstracts Views on Vision4Press platform.
Data correspond to usage on the plateform after 2015. The current usage metrics is available 48-96 hours after online publication and is updated daily on week days.
Initial download of the metrics may take a while.