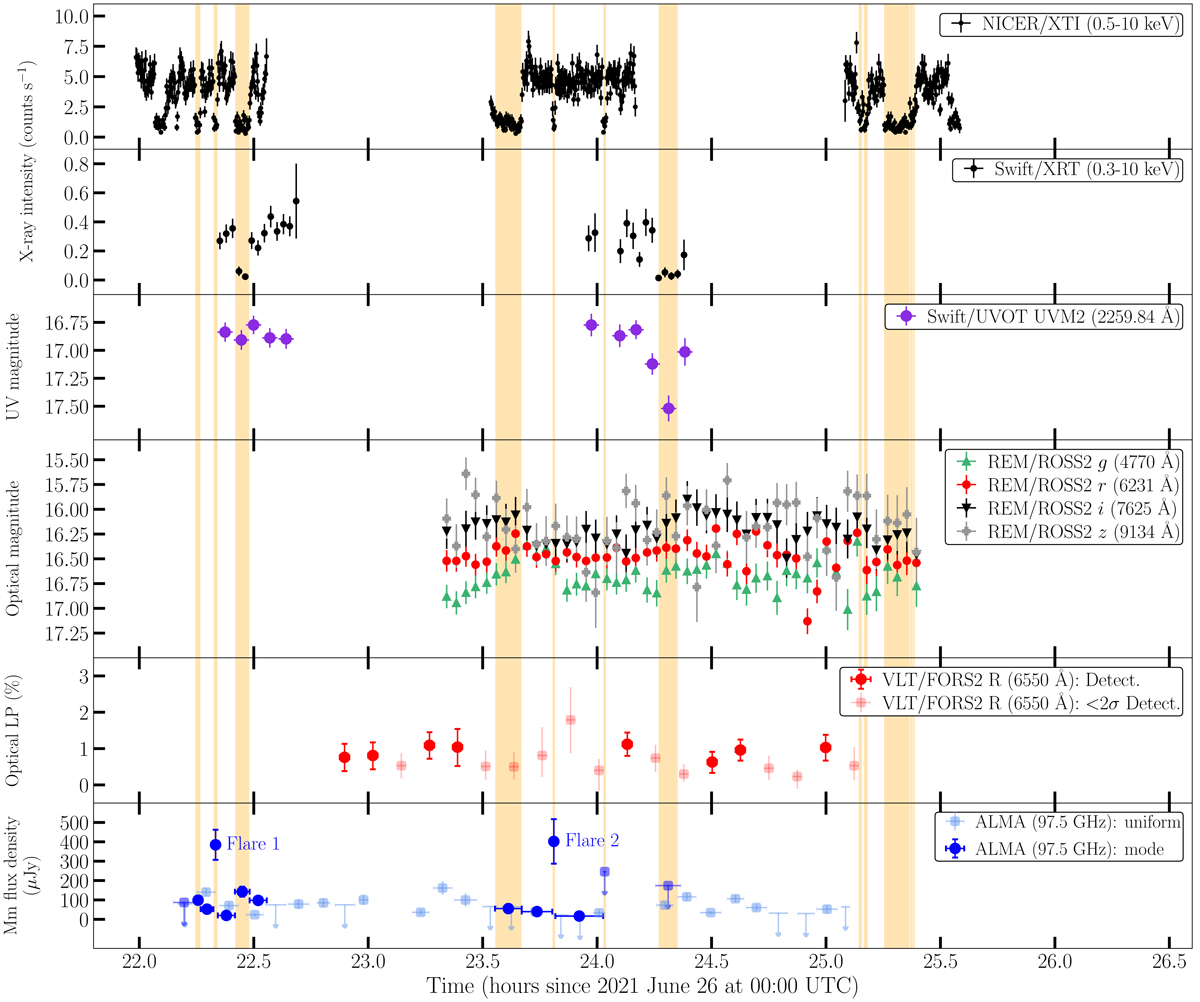
Fig. 3.
Download original image
Temporal evolution of the X-ray, UV, optical, and millimetre emissions and of the optical LP of J1023 on the night of 2021 June 26–27. The light curves are shown in decreasing order of energy band from top to bottom (NICER, Swift/XRT, Swift/UVOT, REM, VLT/FORS2 polarisation, and ALMA). In the bottom panel, the ALMA time series are plotted using either bins of length 4–5 min (cyan) or bins of variable length corresponding to the duration of the X-ray mode episodes identified by the strictly simultaneous NICER and Swift data (blue). In some panels, the sizes of the markers are bigger than the uncertainties and/or the time bins. Arrows indicate 3σ upper limits. The orange shaded areas mark the time intervals of low X-ray mode detected by NICER and Swift/XRT covered by observations with other instruments. A plot of the X-ray and millimetre light curves around the epoch of the millimetre flares is shown in Fig. 6.
Current usage metrics show cumulative count of Article Views (full-text article views including HTML views, PDF and ePub downloads, according to the available data) and Abstracts Views on Vision4Press platform.
Data correspond to usage on the plateform after 2015. The current usage metrics is available 48-96 hours after online publication and is updated daily on week days.
Initial download of the metrics may take a while.