Fig. 1.
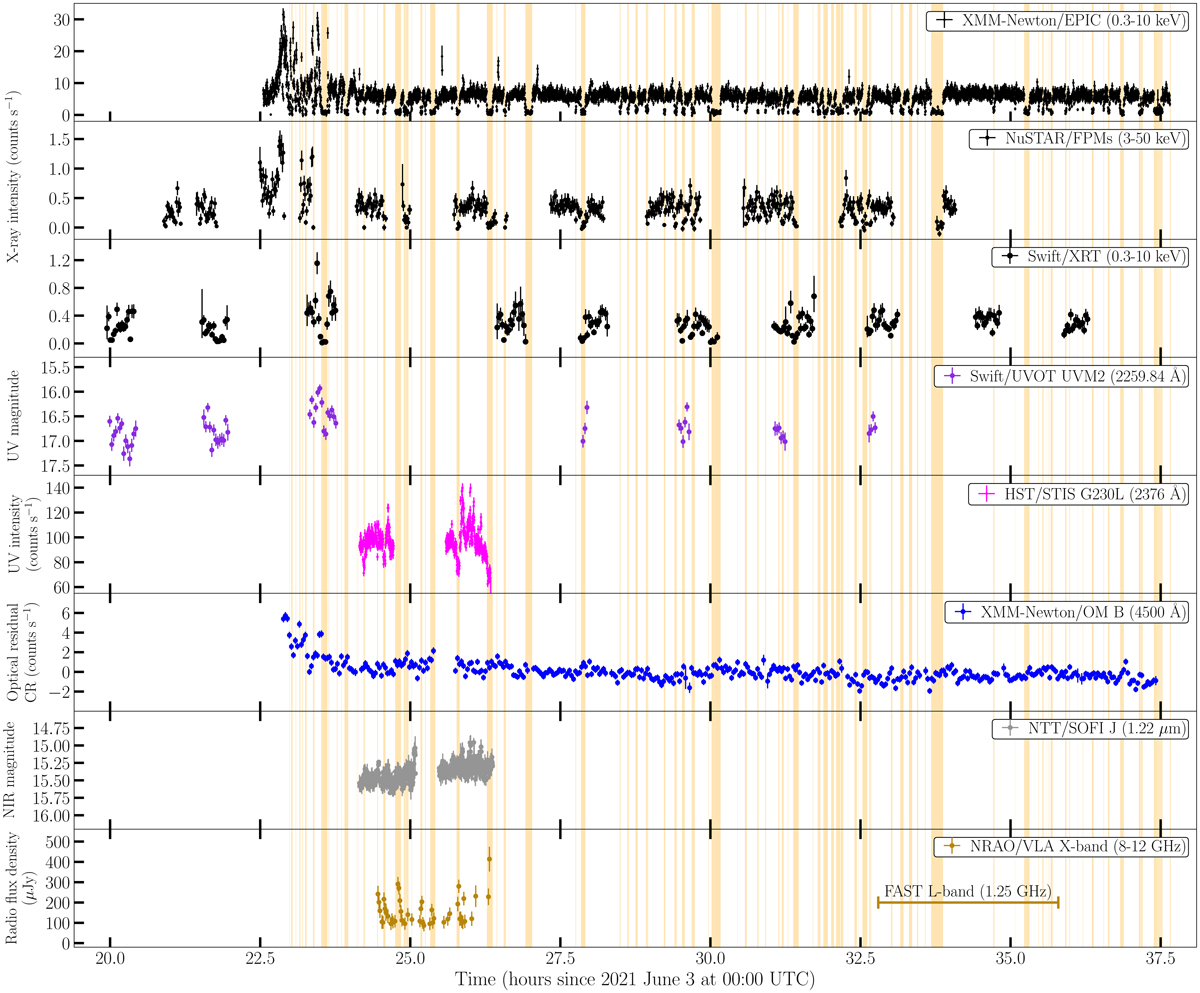
Download original image
Temporal evolution of the X-ray, UV, optical, NIR, and radio emissions of J1023 on the night of 2021 June 3–4. The light curves are shown in decreasing order of energy band from top to bottom, with the XMM-Newton/EPIC one as the reference for all others (NuSTAR, HST/STIS, XMM-Newton/OM, NTT/SOFI, and VLA). The XMM-Newton X-ray light curve is shown over the time interval in which the three EPIC instruments collected data simultaneously. The OM residual count rates were obtained after removing the orbital modulation from the time series (see the main text for details). For displaying purposes, only VLA detections are shown. The dark yellow segment in the bottom panel indicates the time range covered by the FAST observation. The orange shaded areas mark the time intervals of the low X-ray mode detected by XMM-Newton/EPIC covered by observations with other instruments.
Current usage metrics show cumulative count of Article Views (full-text article views including HTML views, PDF and ePub downloads, according to the available data) and Abstracts Views on Vision4Press platform.
Data correspond to usage on the plateform after 2015. The current usage metrics is available 48-96 hours after online publication and is updated daily on week days.
Initial download of the metrics may take a while.