Open Access
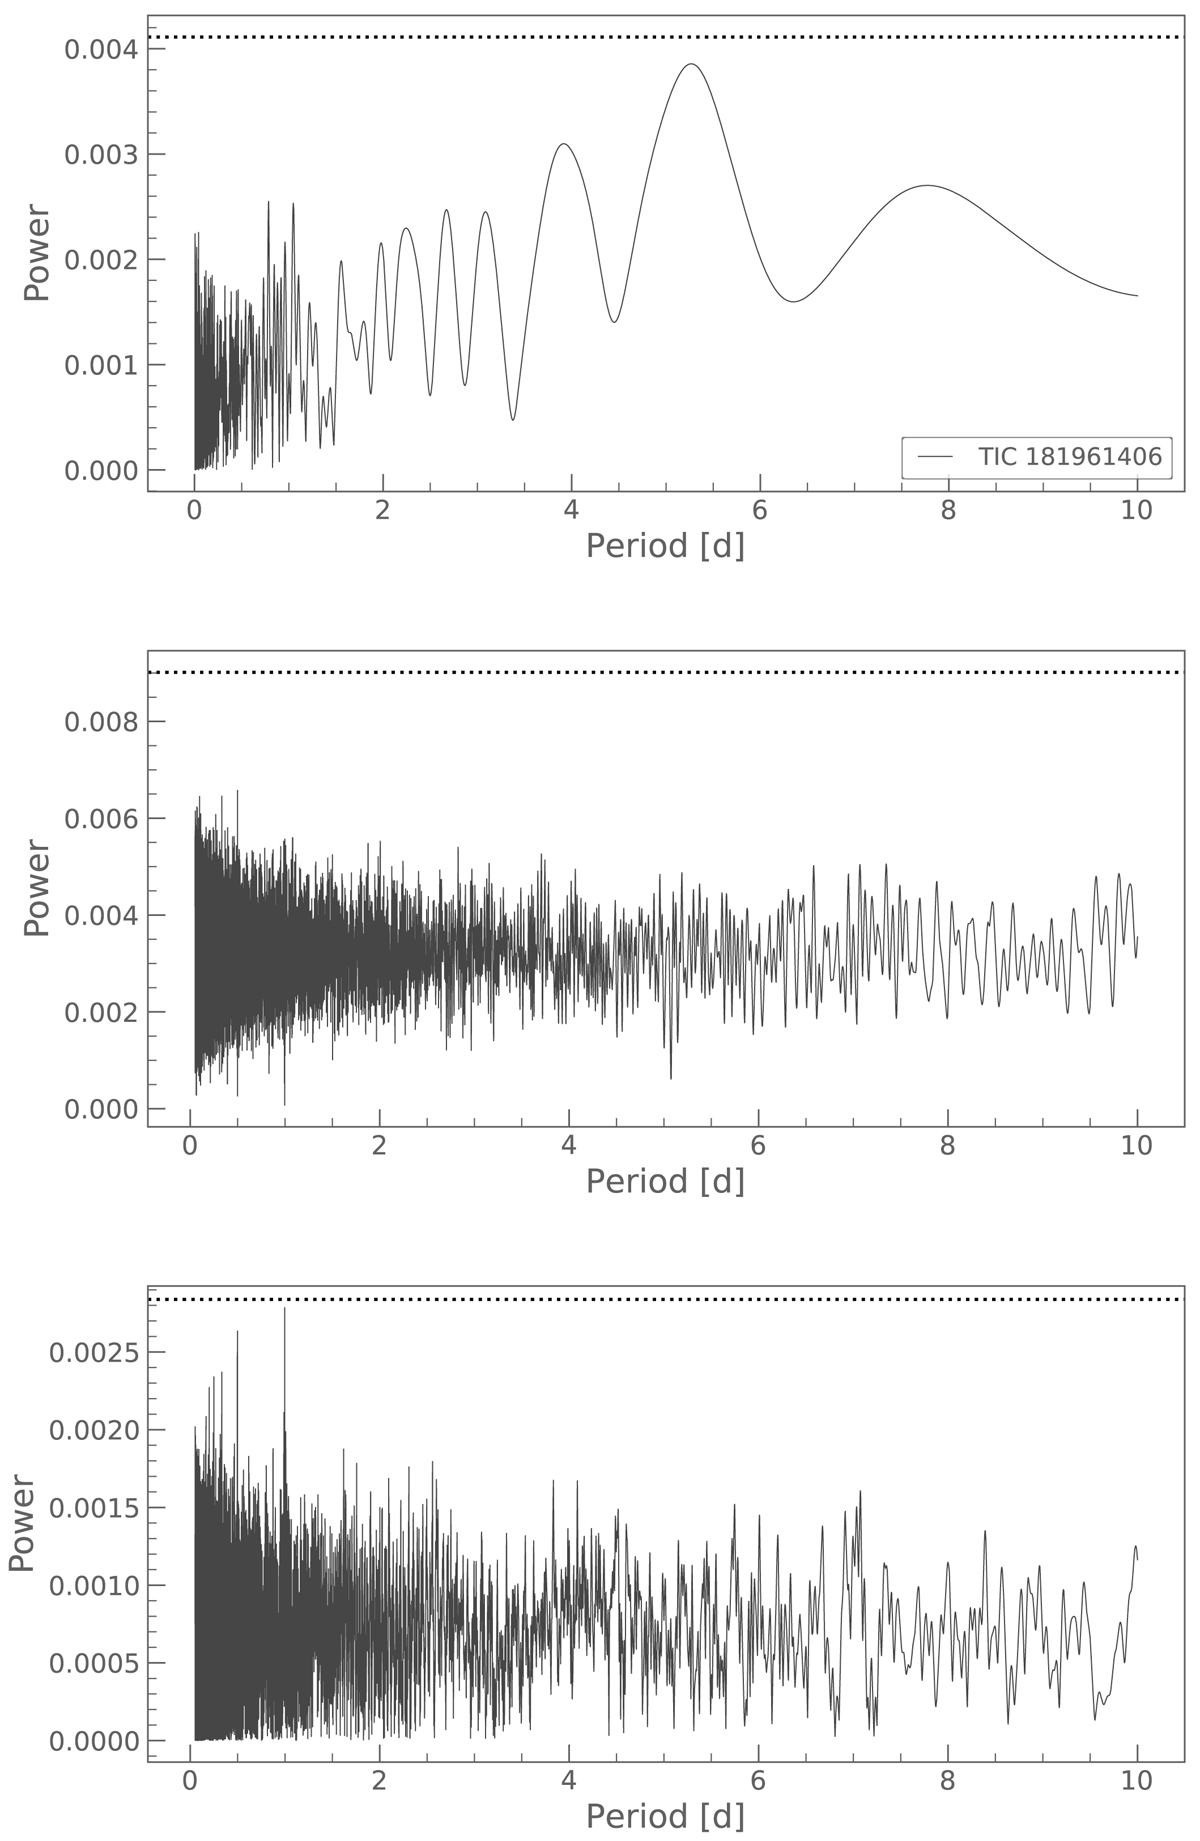
Fig. A.2.
Download original image
Power spectra of light curves of BPS BS 16981−0016 (TIC 181961406) from TESS (upper panel) as well as ZTF g band (middle panel) and r band (lower panel). The 1% false-alarm level is indicated by the dashed line.
Current usage metrics show cumulative count of Article Views (full-text article views including HTML views, PDF and ePub downloads, according to the available data) and Abstracts Views on Vision4Press platform.
Data correspond to usage on the plateform after 2015. The current usage metrics is available 48-96 hours after online publication and is updated daily on week days.
Initial download of the metrics may take a while.