Open Access
Fig. 2.
Download original image
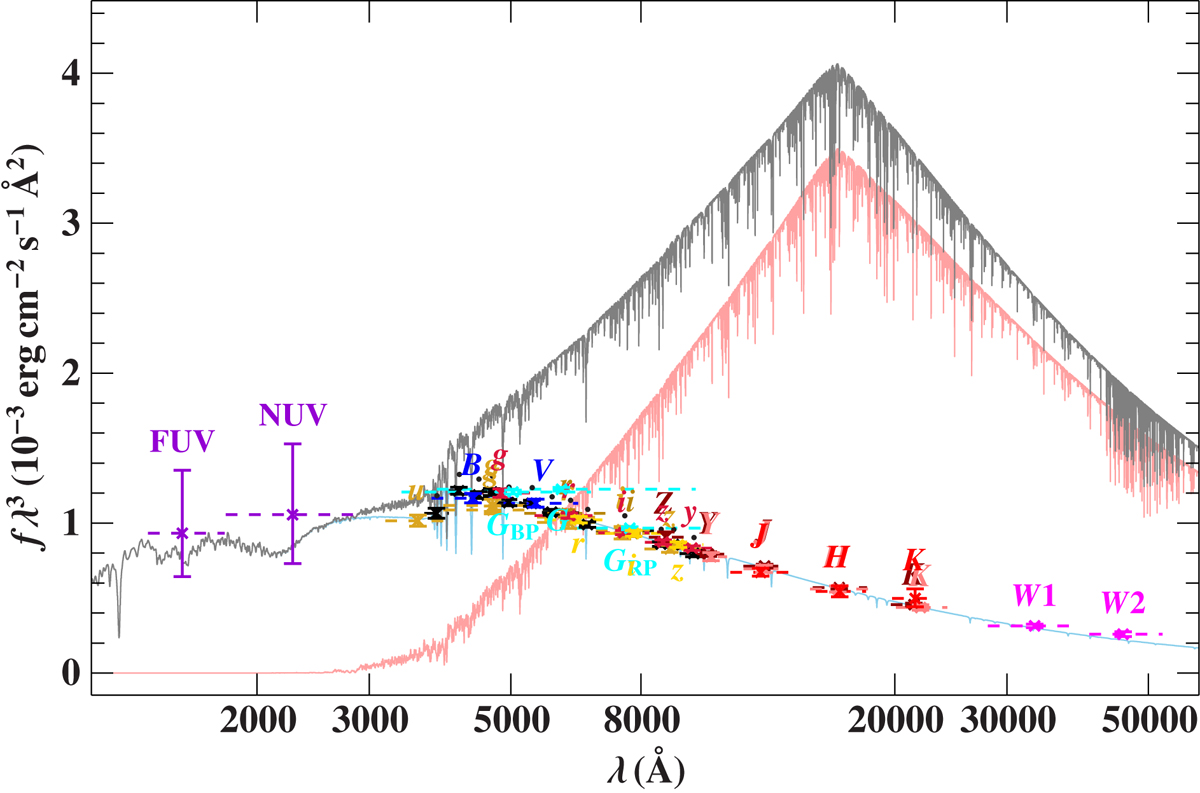
Spectral energy distribution similar to Fig. 1. To illustrate the contribution of a G-type star with 1 M⊙ to the SED a model (light red) has been added to the best-fit model of the sdB (light blue). The resulting composite model is shown in grey.
Current usage metrics show cumulative count of Article Views (full-text article views including HTML views, PDF and ePub downloads, according to the available data) and Abstracts Views on Vision4Press platform.
Data correspond to usage on the plateform after 2015. The current usage metrics is available 48-96 hours after online publication and is updated daily on week days.
Initial download of the metrics may take a while.