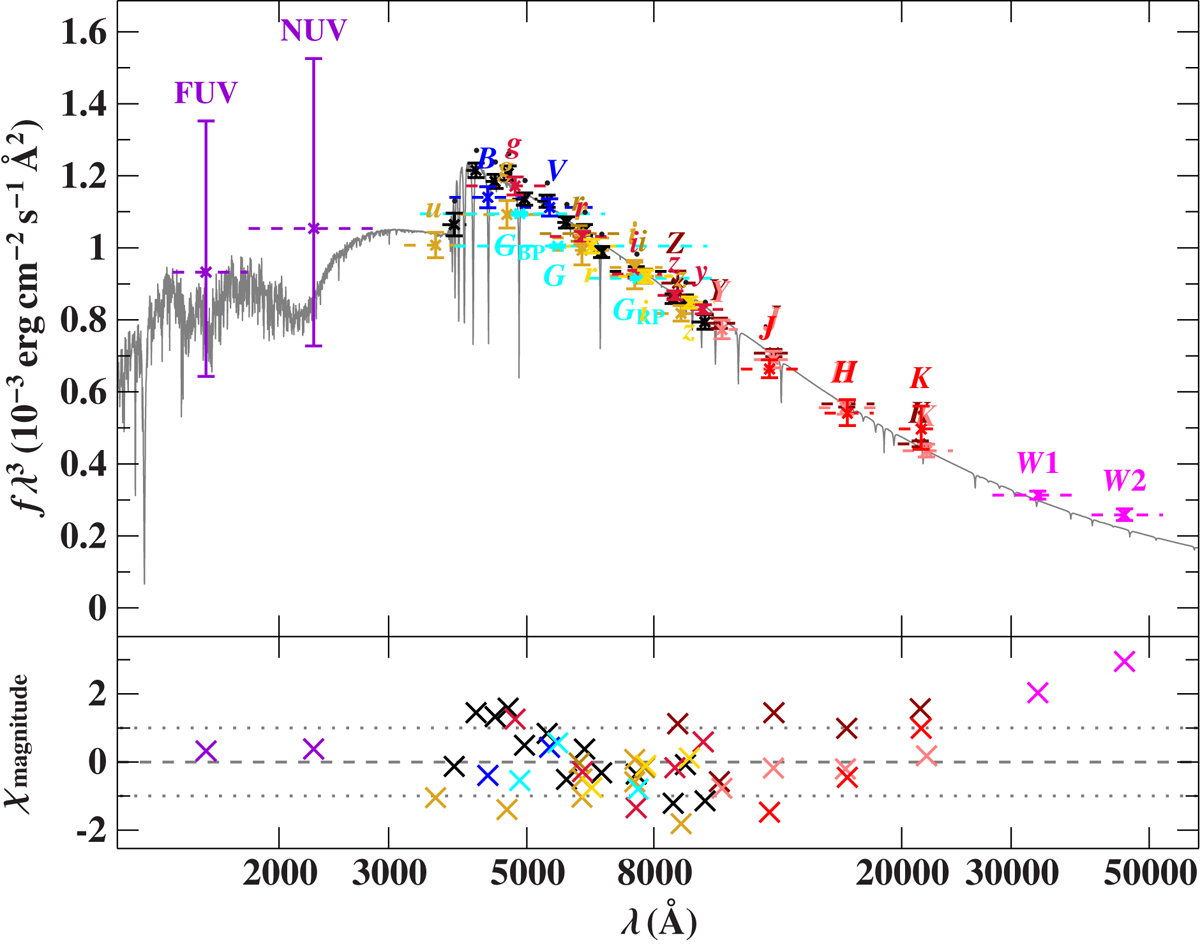
Fig. 1.
Download original image
Spectral energy distribution of BPS BS 16981−0016. Top panel: filter-averaged fluxes converted from observed magnitudes from different photometric surveys are shown (violet: GALEX, Bianchi et al. 2017; bright yellow: DELVE, Drlica-Wagner et al. 2021; cyan: Gaia EDR3, Riello et al. 2021; black: Gaia DR3 XP box filters, Gaia Collaboration 2023; blue: APASS9, Henden et al. 2016; yellow: SDSS, Alam et al. 2015; dark yellow: Skymapper, Onken et al. 2019; pink: UKIDSS, Lawrence et al. 2007; dark red: VIKING, Edge et al. 2013; red: 2MASS, Skrutskie et al. 2006; magenta: WISE, Schlafly et al. 2019). The respective full width at tenth maximum are shown as dashed horizontal lines. The best-fitting model, degraded to a spectral resolution of 6 Å, is plotted in grey. In order to reduce the steep SED slope the flux is multiplied by the wavelength cubed. Bottom panel: difference between synthetic and observed magnitudes divided by the corresponding uncertainties (residual χ).
Current usage metrics show cumulative count of Article Views (full-text article views including HTML views, PDF and ePub downloads, according to the available data) and Abstracts Views on Vision4Press platform.
Data correspond to usage on the plateform after 2015. The current usage metrics is available 48-96 hours after online publication and is updated daily on week days.
Initial download of the metrics may take a while.