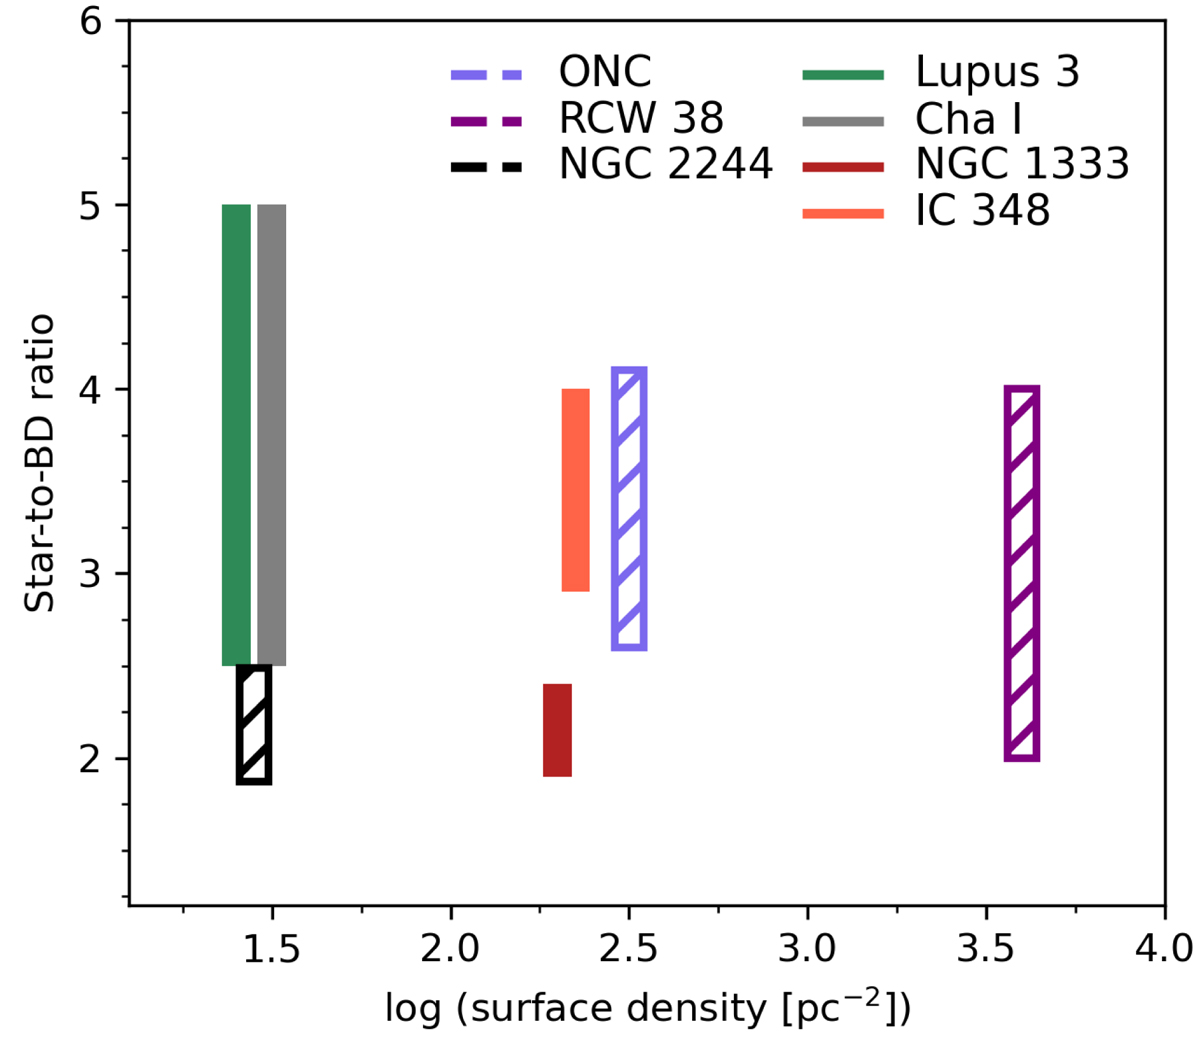
Fig. 11.
Download original image
Dependence of the star-to-BD number ratio on cluster surface density. Different regions are represented by polygons of different colors. The height of each polygon represents either the ±1σ range around the mean value or the range in star-to-BD number ratio if given in this form. The width of the polygons has no physical meaning. The filled polygons represent the regions with few or no massive stars, while the dashed ones mark the regions with substantial OB star population. The result shown for NGC 2244 is the one calculated correcting for completeness with the IMF power-law fit performed between 0.045 and 0.4 M⊙.
Current usage metrics show cumulative count of Article Views (full-text article views including HTML views, PDF and ePub downloads, according to the available data) and Abstracts Views on Vision4Press platform.
Data correspond to usage on the plateform after 2015. The current usage metrics is available 48-96 hours after online publication and is updated daily on week days.
Initial download of the metrics may take a while.