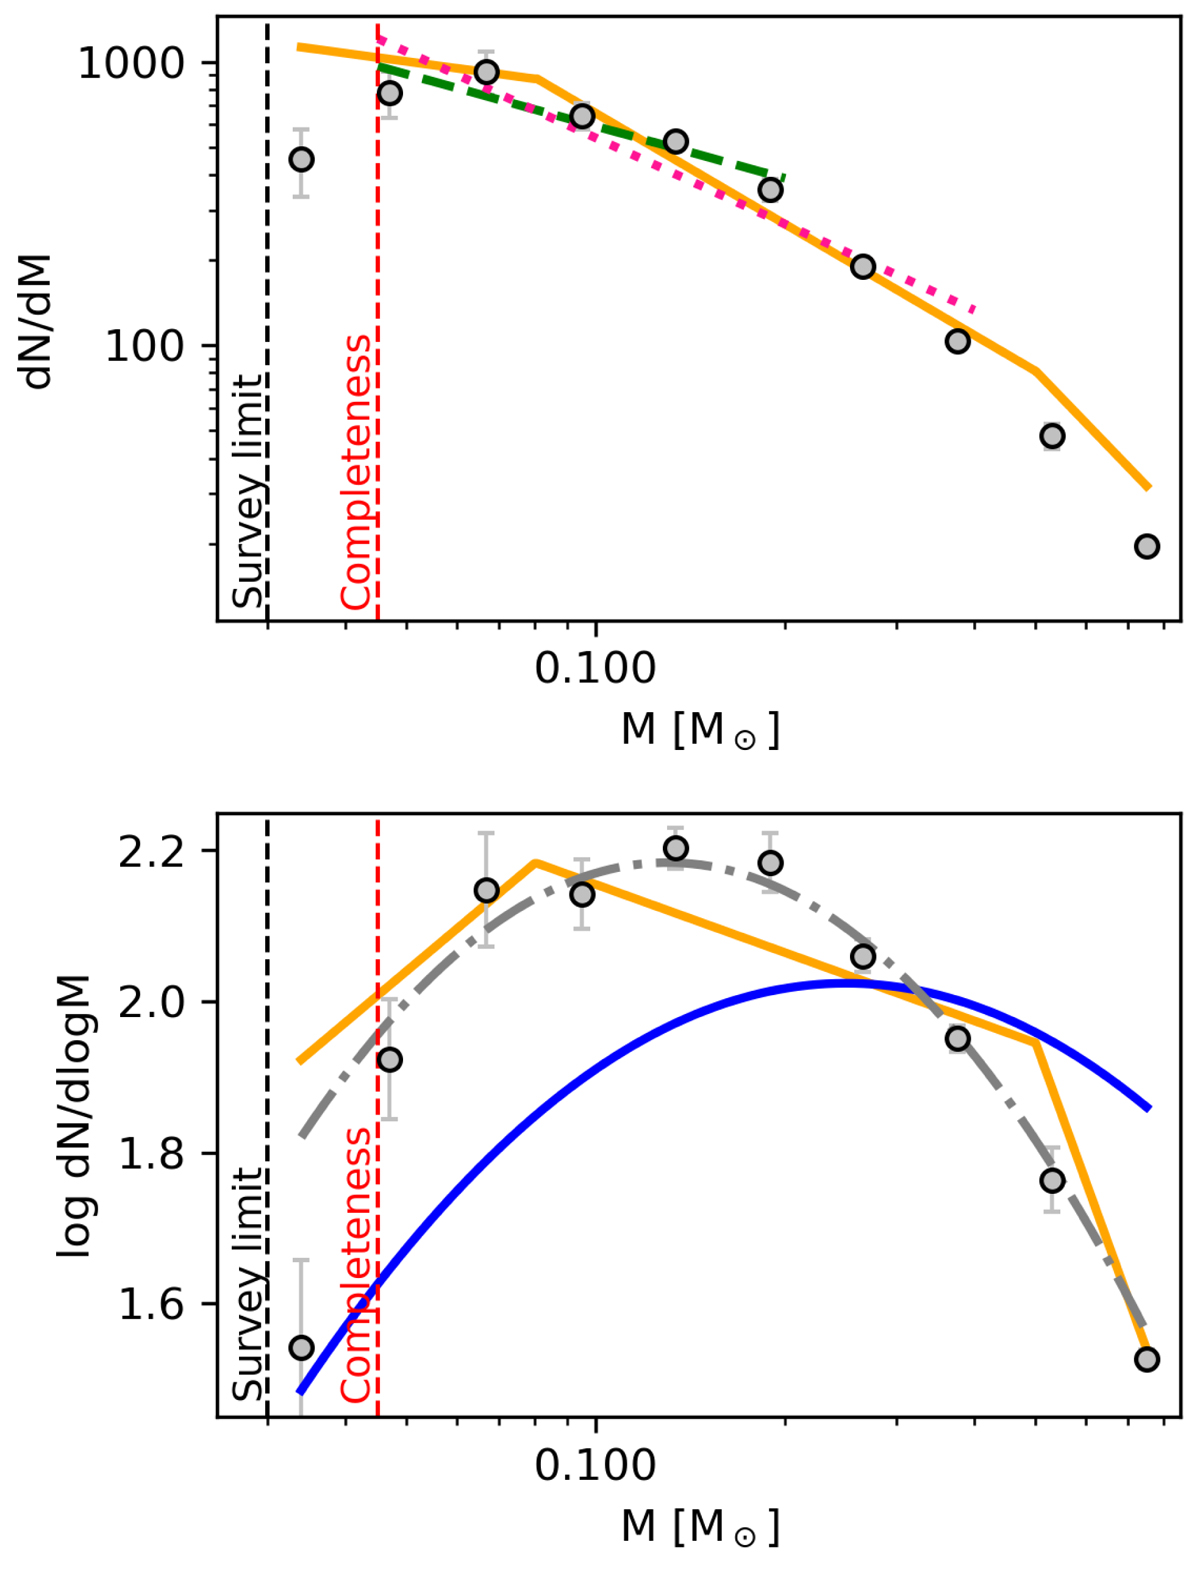
Fig. 10.
Download original image
IMF of the central region of NGC 2244 considering both KMOS and Meng et al. (2017) possible members with P = 0.5 (see text), represented in equal-size logarithmic bins with size Δlog(m/M⊙) = 0.15. Two different IMF representations are shown: dN/dm (top panel) and dN/dlog(m) (bottom panel). The green dashed and the pink dotted lines in the top panel represent the power-law fits performed between 0.045–0.2 M⊙ and 0.045–0.4 M⊙ respectively. The orange solid line (both panels) represents the Kroupa segmented power-law mass function (Kroupa 2001), the blue solid line (bottom panel) shows the Chabrier mass function (Chabrier 2005) and the gray dash-dotted line (bottom panel) represents a log-normal function with a characteristic mass (mc) of 0.13 M⊙ and standard deviation (σ) of 0.45. The three representations of the IMF are normalized to match the total number of objects in the cluster. The black vertical dashed line at 0.03 M⊙, and the red line at 0.045 M⊙ represent the KMOS survey limit and the true mass completeness of our sample respectively.
Current usage metrics show cumulative count of Article Views (full-text article views including HTML views, PDF and ePub downloads, according to the available data) and Abstracts Views on Vision4Press platform.
Data correspond to usage on the plateform after 2015. The current usage metrics is available 48-96 hours after online publication and is updated daily on week days.
Initial download of the metrics may take a while.