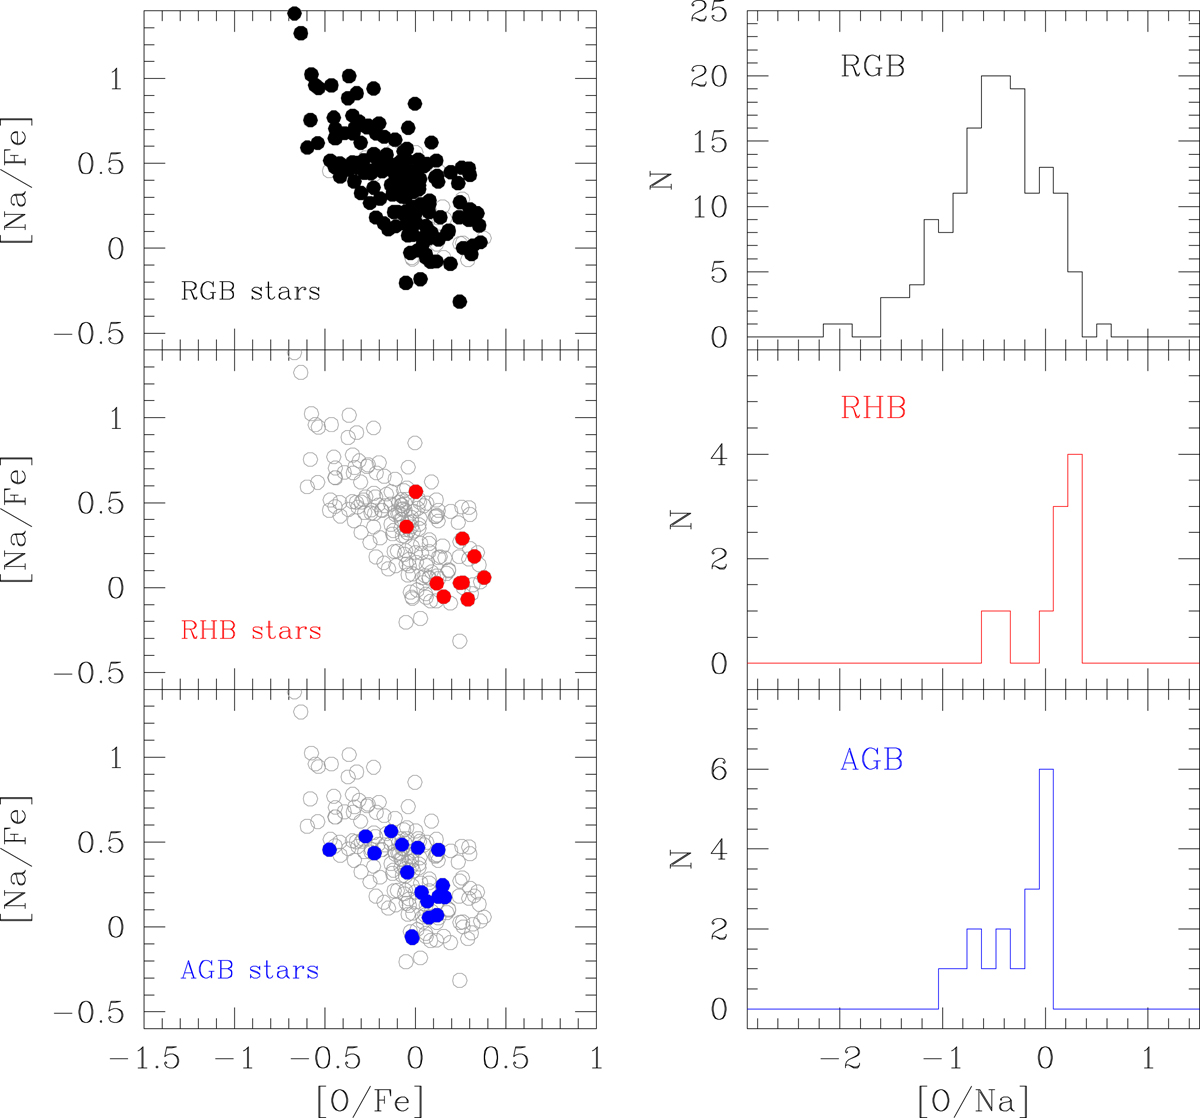
Fig. 3.
Download original image
Anti-correlation of Na and O abundances in stars of NGC 6388 in different evolutionary phases. In all three panels on the left, open circles are our total sample. In the top left panel, we plot RGB stars as filled circles. In the middle and lower panels, we superimpose values for RHB and AGB stars, in red and blue filled circles, respectively. In the right column, we show the observed distributions of the [O/Na] abundance ratios for RGB, RHB, and AGB stars, from top to bottom, respectively.
Current usage metrics show cumulative count of Article Views (full-text article views including HTML views, PDF and ePub downloads, according to the available data) and Abstracts Views on Vision4Press platform.
Data correspond to usage on the plateform after 2015. The current usage metrics is available 48-96 hours after online publication and is updated daily on week days.
Initial download of the metrics may take a while.