Fig. 9
Download original image
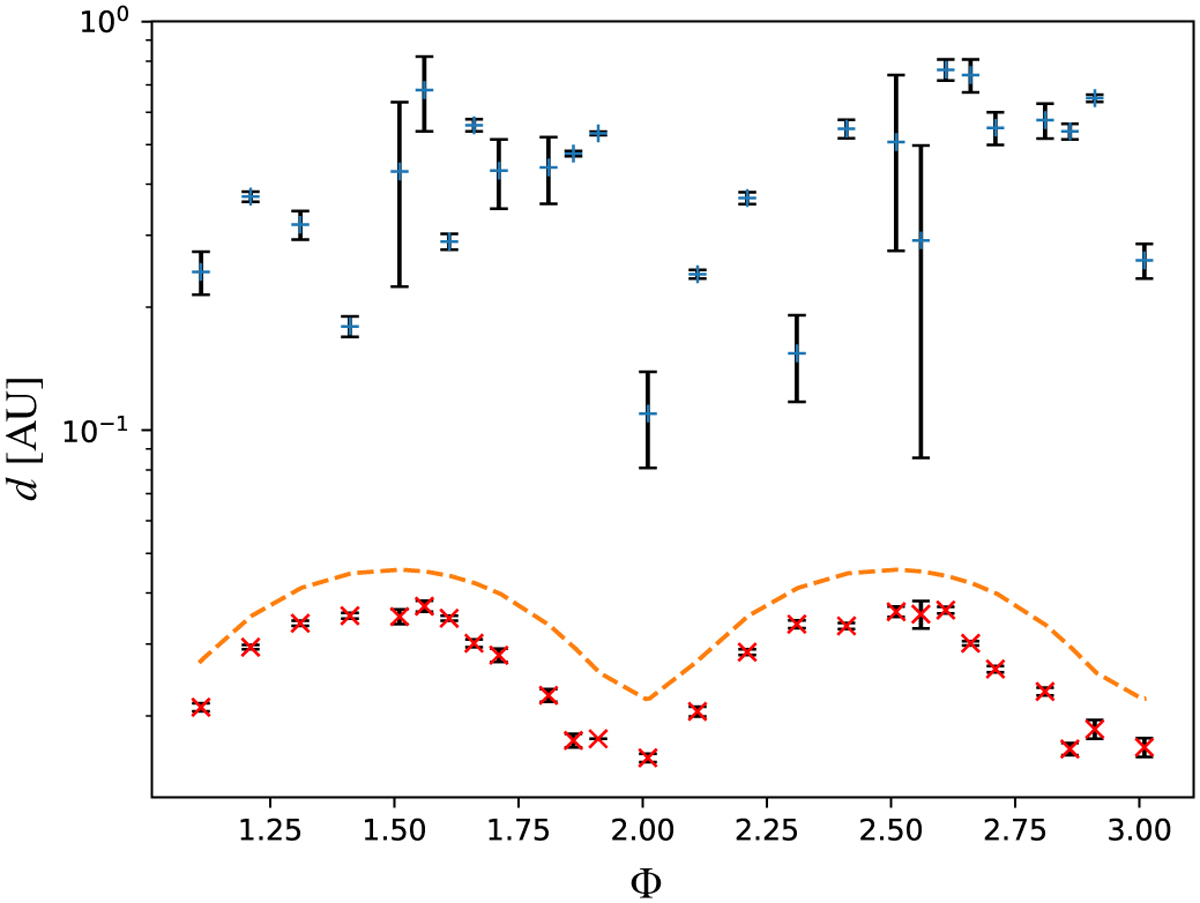
Distance of the Coriolis shock (blue plus signs) and bow shock (red crosses) from the location of the pulsar as functions of orbital phase, where distances are given along the line connecting star and pulsar. Average values and error bars were determined as stated in Fig. 8. The y-ахis uses logarithmic units to allow showing both shock distances simultaneously. Additionally, the dashed orange line shows the approximate distance of the contact discontinuity from the pulsar in the direction of the star using the formula by Eichler & Usov (1993).
Current usage metrics show cumulative count of Article Views (full-text article views including HTML views, PDF and ePub downloads, according to the available data) and Abstracts Views on Vision4Press platform.
Data correspond to usage on the plateform after 2015. The current usage metrics is available 48-96 hours after online publication and is updated daily on week days.
Initial download of the metrics may take a while.