Fig. 3
Download original image
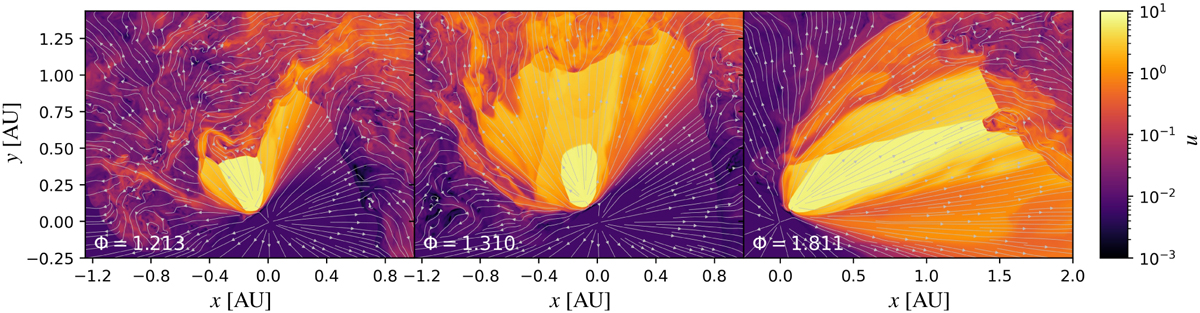
Absolute value of the spatial component of the fluid’s four velocity in the orbital plane at selected phases as indicated in the plots. Superimposed over the images, we indicate the direction of the flow via streamlines. Here, we only show results for a part of the orbital plane, focussing on the region around the Coriolis shock. We note the different x-axis in the right-handed plot.
Current usage metrics show cumulative count of Article Views (full-text article views including HTML views, PDF and ePub downloads, according to the available data) and Abstracts Views on Vision4Press platform.
Data correspond to usage on the plateform after 2015. The current usage metrics is available 48-96 hours after online publication and is updated daily on week days.
Initial download of the metrics may take a while.