Fig. 9
Download original image
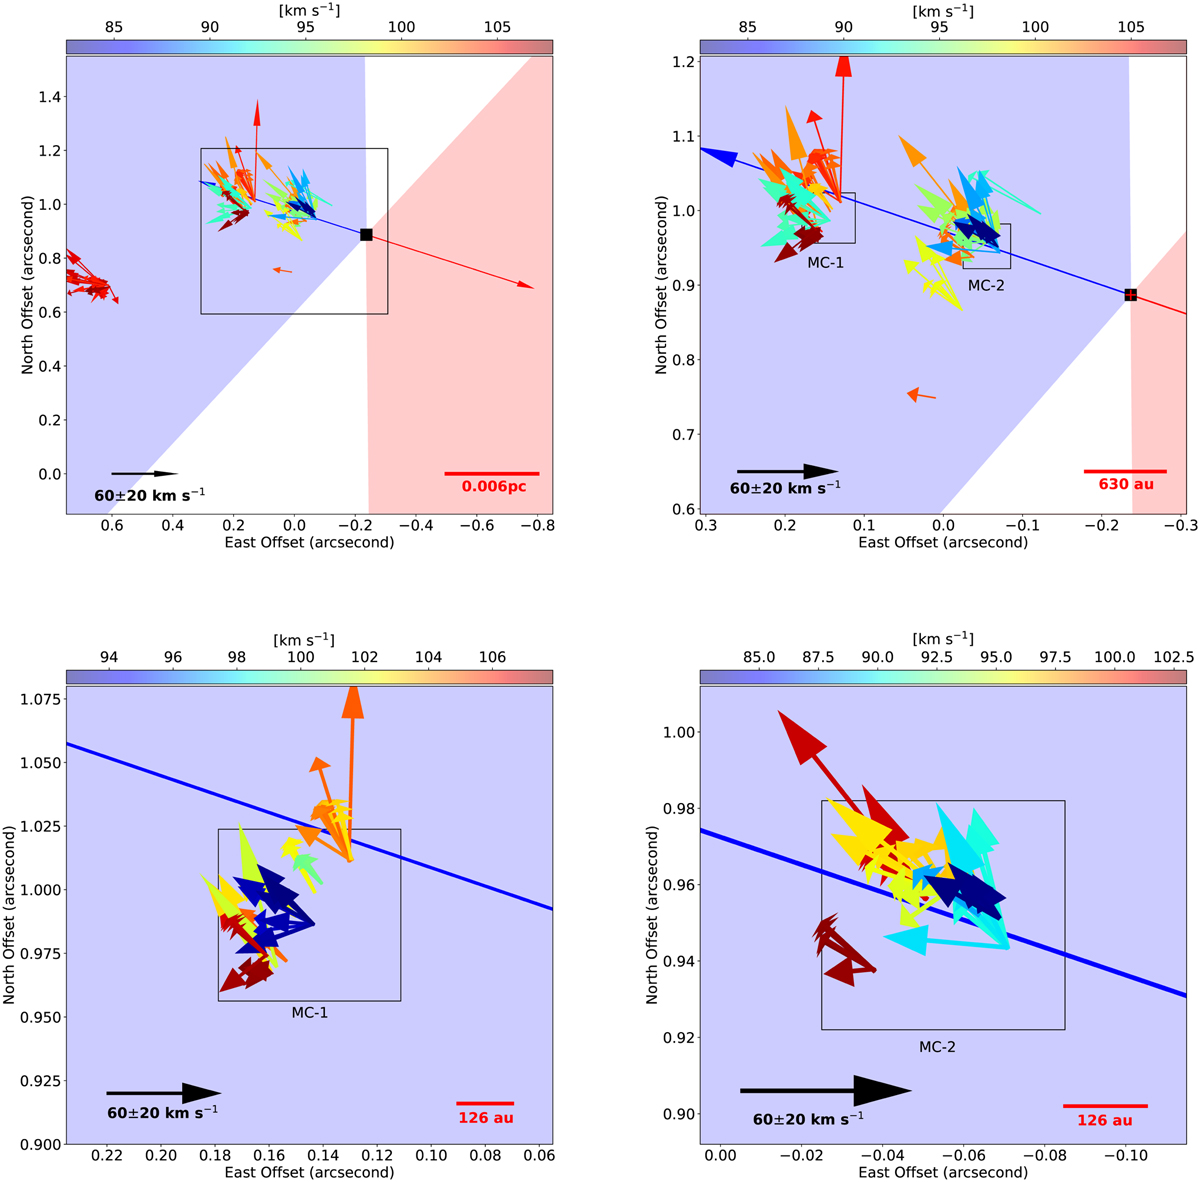
Proper motions derived with 15-epoch VLBA observations. Top left panel: plot of the proper motions of spots persisting more than five epochs. The arrows demonstrate the proper motions of the maser spots. The length (including head), direction, and the head length of the arrow illustrate the magnitude, direction, and error of the proper motion. Top right panel: same as the left panel but zooming into the region that is illustrated by the black rectangle in the top left panel. The filled square in each panel denotes the peak positions of MM1. The red cross in the top right panel represents the fitted position error of MM1, which is about 0″.014. Black rectangles illustrate the zoom-in regions of Fig. 7. Bottom panels: same as the top two panels but for the two maser clusters MC-1 and MC-2.
Current usage metrics show cumulative count of Article Views (full-text article views including HTML views, PDF and ePub downloads, according to the available data) and Abstracts Views on Vision4Press platform.
Data correspond to usage on the plateform after 2015. The current usage metrics is available 48-96 hours after online publication and is updated daily on week days.
Initial download of the metrics may take a while.