Fig. 6
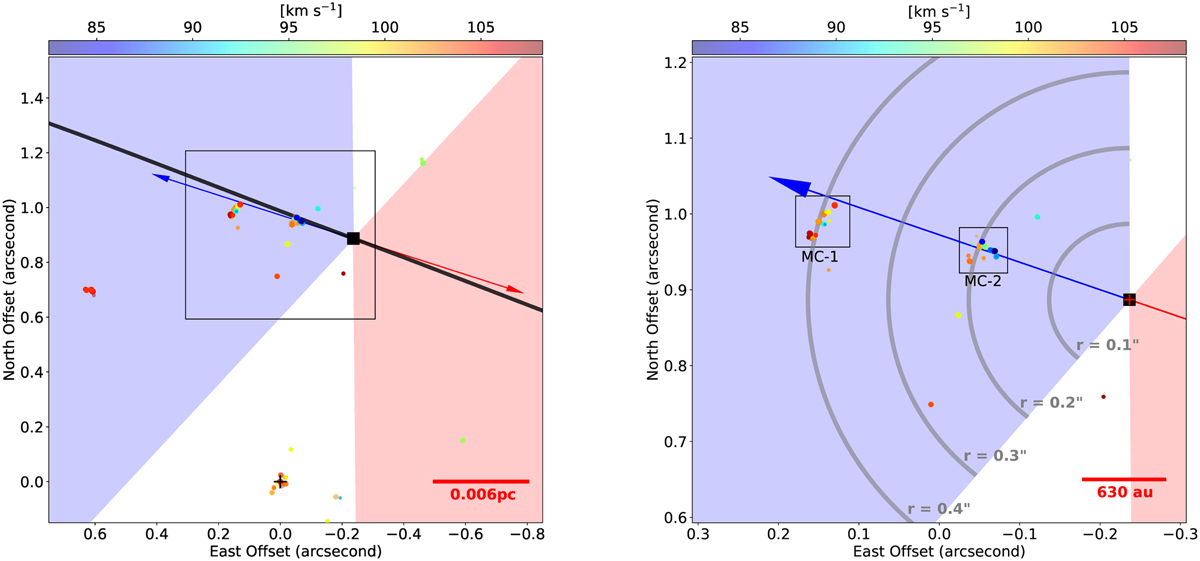
Download original image
Water maser spots detected by the VLBA observations. Panel a: the plot of all the maser spots detected with the 15 epoch VLBA observations. Panel b: the zoom-in image of the black box in panel a. The reference maser spot at (0, 0) is illustrated by the black cross in the left panel. In all the panels the colors of the spots represent their line-of-sight velocities and the sizes are proportional to their fluxes. The blue and red arrows in the two panels indicate the jet symmetry axis of the jet determined by the jet precession fitting (see Sect. 3.3). The filled square in each panel denotes the peak positions of MM1. The red cross in the right panel represents the fitted position error of MM1, which is about 0″.014. The blue and red shadowed regions denote the outflow regions, which are the regions outlined by the gray lines in Fig. 3. The black line in the left panel shows the loci of the preces sing jet (as in Fig. 3).
Current usage metrics show cumulative count of Article Views (full-text article views including HTML views, PDF and ePub downloads, according to the available data) and Abstracts Views on Vision4Press platform.
Data correspond to usage on the plateform after 2015. The current usage metrics is available 48-96 hours after online publication and is updated daily on week days.
Initial download of the metrics may take a while.