Fig. 3
Download original image
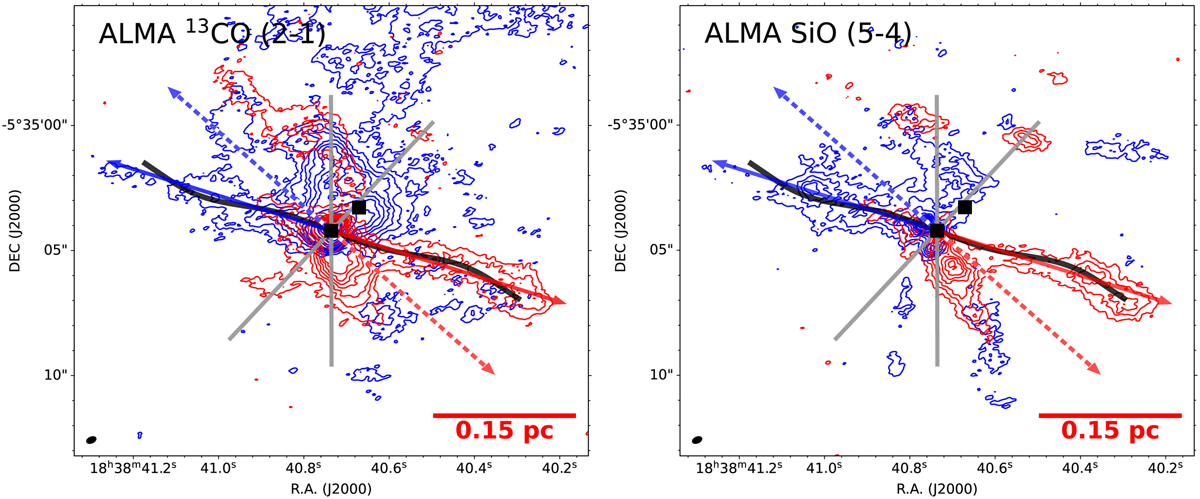
ALMA 13CO (2-1) (left panel) and SiO (5-4) (right panel) images of G26.50+0.28. The blue contours in each panel are integrated from 70 to 103 km s−1 and the red ones are integrated from 105 to 138 km s−1. The contour levels of 13CO (2-1) are set to [4, 8, 12, 16, 20, 24, 28, 40, 52, 64, 76, 88, 100] × 28.5 mly beam−1 km s−1. The SiO (5-4) levels are set to [4, 8, 12, 16, 20, 24, 28, 32, 40, 48] × 28.7 mly beam−1 km s−1. The blue and red arrows in the two panels indicate the direction of the jet. The dashed blue and red arrows denote the axis of the biconical outflow determined by Qiu et al. (2012). The solid gray lines denote the shells of the wide-angle outflow with opening angle of about 140°. A filled ellipse in the lower left of each panel shows the beams. The filled squares denote the peak positions of MM1 and MM2. The black curved lines denote the loci of the precessing jet.
Current usage metrics show cumulative count of Article Views (full-text article views including HTML views, PDF and ePub downloads, according to the available data) and Abstracts Views on Vision4Press platform.
Data correspond to usage on the plateform after 2015. The current usage metrics is available 48-96 hours after online publication and is updated daily on week days.
Initial download of the metrics may take a while.