Fig. 2
Download original image
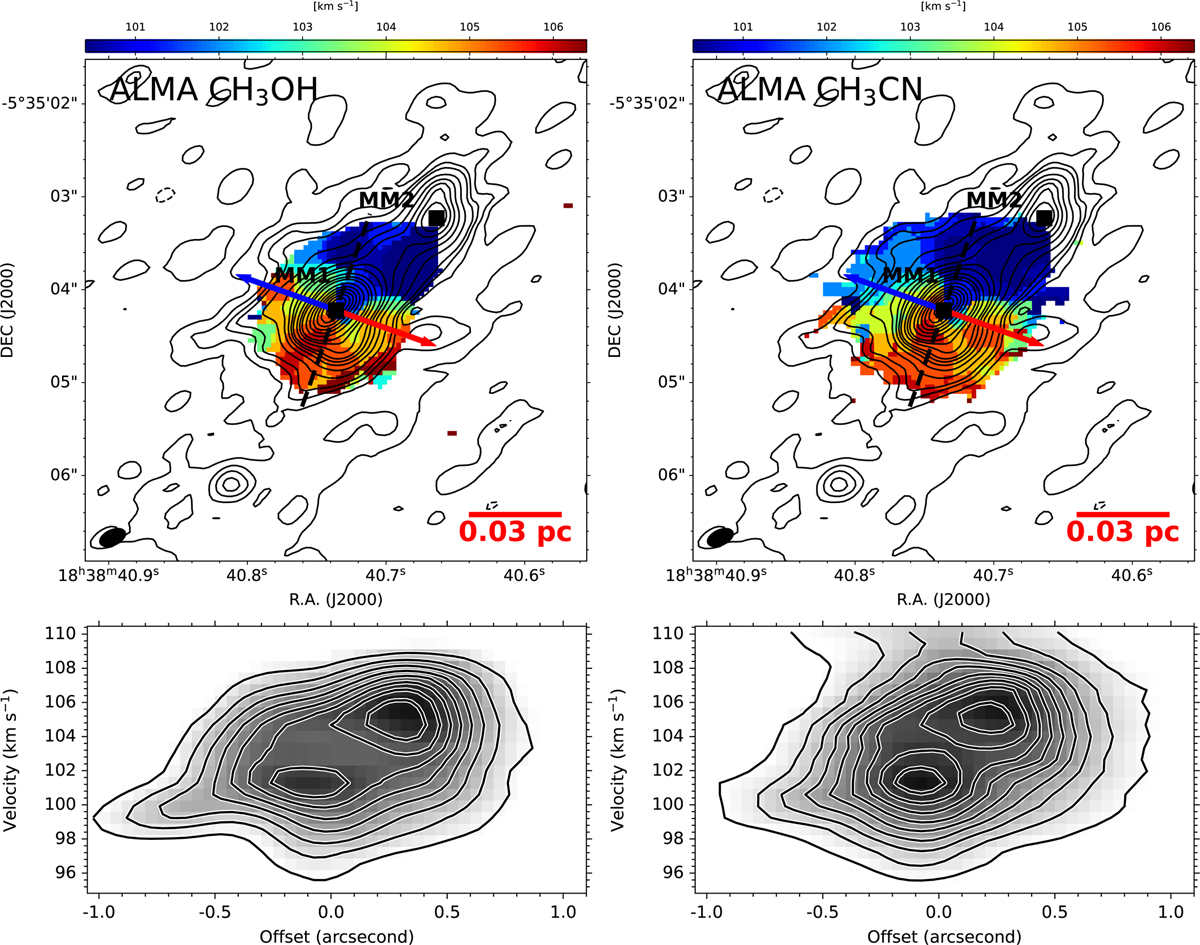
ALMA velocity of the maximum value of the spectrum (peak velocity) images of CH3OH (61,5−72,6 vt=1) (top left panel) and CH3CN (127−117 vt=1) (top right panel). A filled ellipse in the lower left of each panel shows the FWHM beam sizes. The contours overlaid in the two panels are the same as those in the left panel of Fig. 1. The blue and red arrows indicate the symmetry axis of the jet. The filled squares denote the peak positions of the two cores which are labeled as MM1 and MM2. A dashed line in each of the top panels illustrates the P-V cut perpendicular to the jet. The lower panels show the P-V diagrams of CH3OH (61,5−72,6 vt=1) (left) and CH3CN (127-117 vt=1) (right). The contours all start from 28 mJy beam−1 and increase in steps of 28 mJy beam−1.
Current usage metrics show cumulative count of Article Views (full-text article views including HTML views, PDF and ePub downloads, according to the available data) and Abstracts Views on Vision4Press platform.
Data correspond to usage on the plateform after 2015. The current usage metrics is available 48-96 hours after online publication and is updated daily on week days.
Initial download of the metrics may take a while.