Open Access
Fig. C.1
Download original image
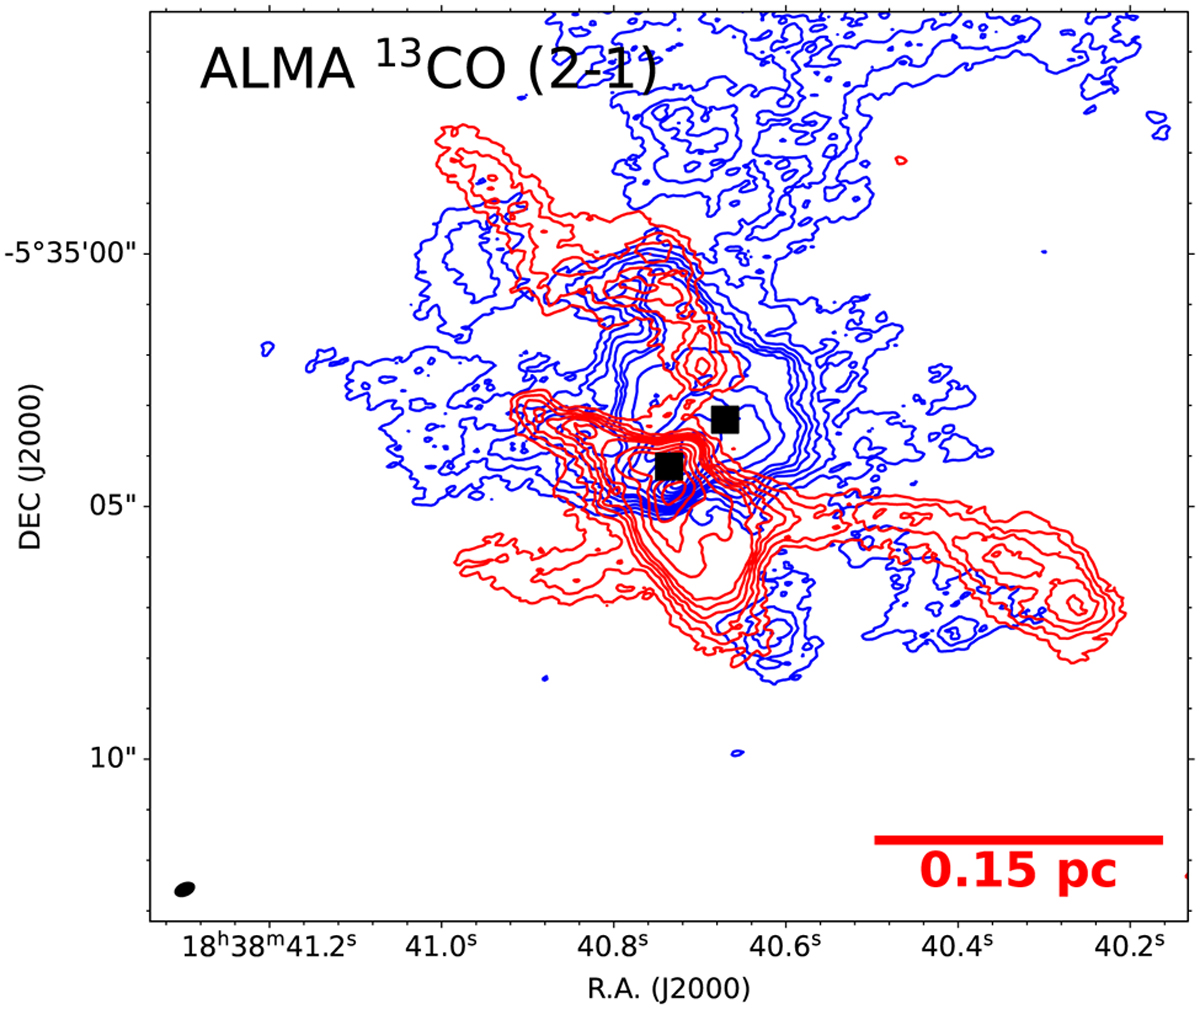
Same as the left panel of Fig. 3 but the blue contours are integrated from 97 to 103 km s−1 and the red ones are integrated from 105 to 111 km s−1. The contour levels of 13CO (2-1) are set to [8, 12, 16, 20, 24, 28, 40, 52, 64, 76, 88, 100]× 12.2 mJy beam−1 km s−1.
Current usage metrics show cumulative count of Article Views (full-text article views including HTML views, PDF and ePub downloads, according to the available data) and Abstracts Views on Vision4Press platform.
Data correspond to usage on the plateform after 2015. The current usage metrics is available 48-96 hours after online publication and is updated daily on week days.
Initial download of the metrics may take a while.