Fig. A.1
Download original image
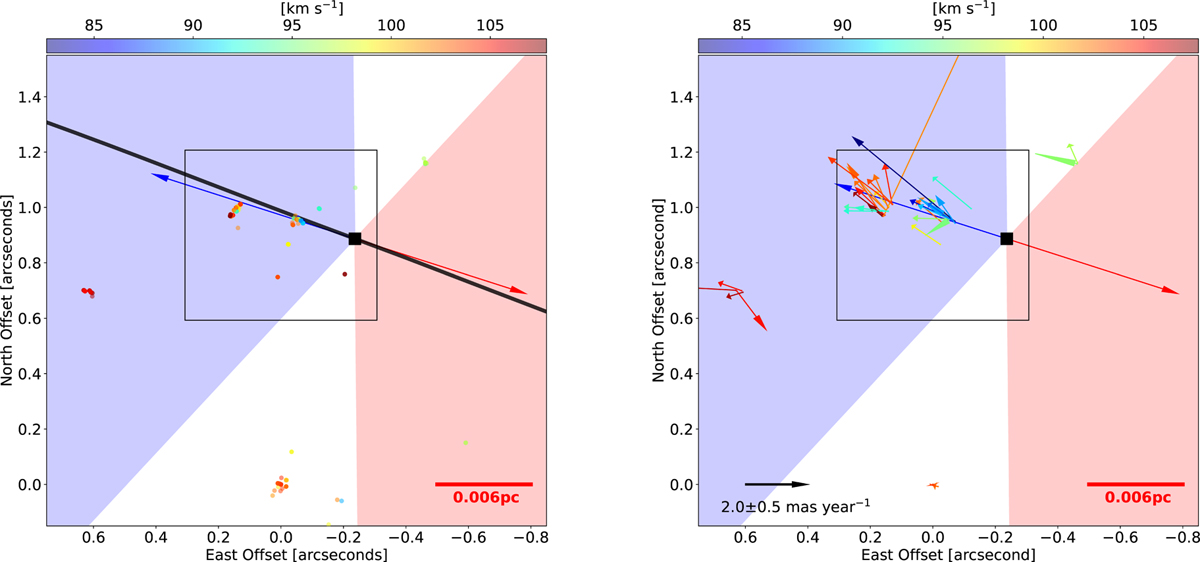
Distribution and proper motions of the water maser features detected by the VLBA observations. Left panel: Plot of all the maser features detected with the 15 epoch VLBA observations. The colors of the dots represent their line-of-sight velocities. The blue and red arrows in the two panels indicate the jet symmetry axis of the jet determined by the jet precession fitting (see Sect. 3.3). The blue and red shadowed regions denote the outflow regions, which are the regions outlined by the gray lines in Fig. 3. The black line in the left panel shows the loci of the precessing jet already introduced in Fig. 3. Right panel: Plot of the proper motions of maser features persisting more than 3 epochs. The arrows indicate the proper motions of the maser features. The length (including head), direction, and the head length of the arrow illustrate the magnitude, direction, and error of the proper motion. Black rectangles in the two panels illustrate the zoom-in region of the right panel of Fig. 6.
Current usage metrics show cumulative count of Article Views (full-text article views including HTML views, PDF and ePub downloads, according to the available data) and Abstracts Views on Vision4Press platform.
Data correspond to usage on the plateform after 2015. The current usage metrics is available 48-96 hours after online publication and is updated daily on week days.
Initial download of the metrics may take a while.