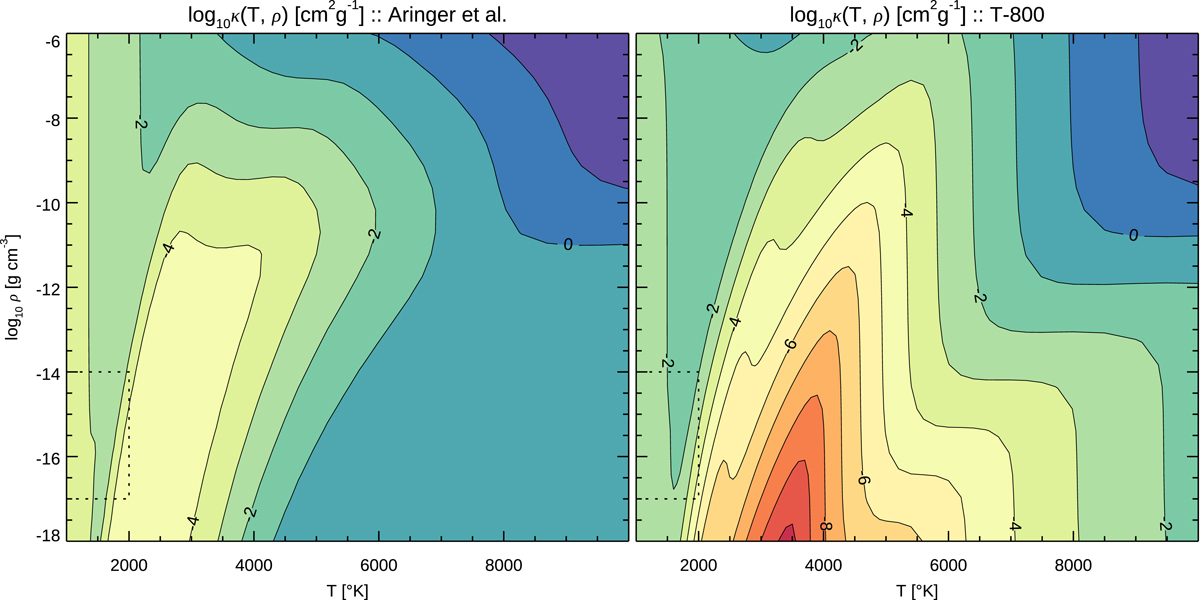
Fig. B.2.
Download original image
Total gas opacity at wavelength closest to λ = 1 μm for the Aringer et al. data (left panel) and our new data (right panel). The opacity is colour-coded and is shown vs temperature (x-axis) and gas density (y-axis). All integers on the contour lines are negative (except 0). The temperature and density ranges are 1000 ≤ T ≤ 10 000 K and −18 ≤ log ρ ≤ −6 g cm−3, respectively. The two panels use the same ranges and colour palette. The dotted box delimits densities and temperatures in the wind formation region of the model shown in Fig. 4.
Current usage metrics show cumulative count of Article Views (full-text article views including HTML views, PDF and ePub downloads, according to the available data) and Abstracts Views on Vision4Press platform.
Data correspond to usage on the plateform after 2015. The current usage metrics is available 48-96 hours after online publication and is updated daily on week days.
Initial download of the metrics may take a while.