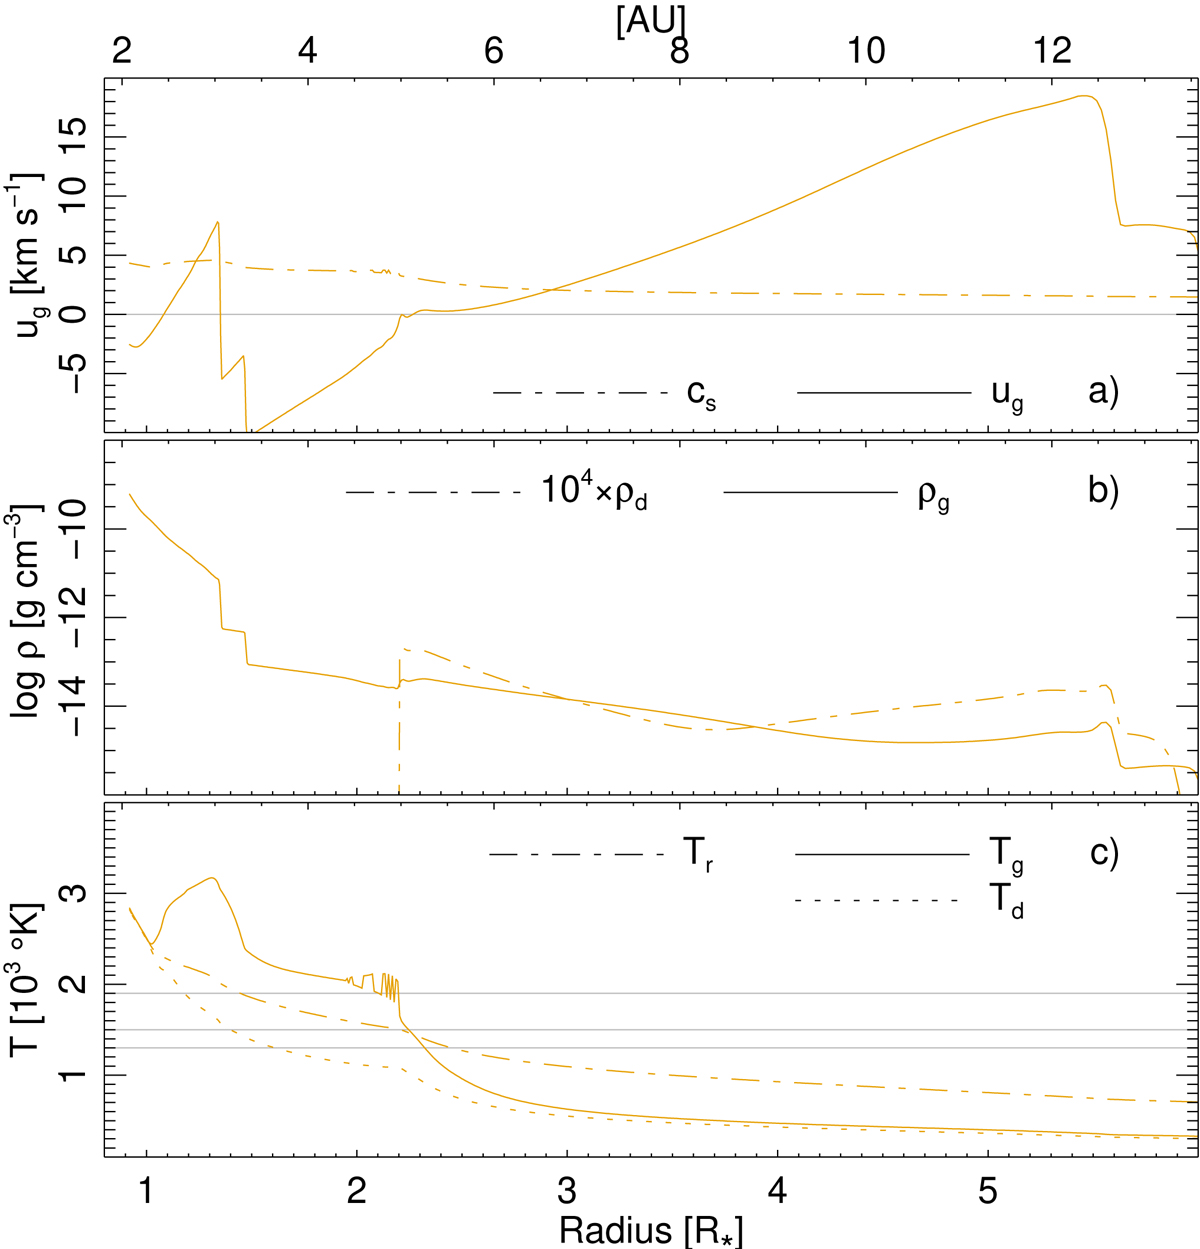
Fig. B.1.
Download original image
Radial structure of snapshot of set-up L3.85T24 for the inner modelled region. A PC model using the gas opacities of Aringer is shown (in orange). The three panels show: (a) gas velocity ug, sound speed cs; (b) gas density ρg, dust density 104 × ρd (log); and (c) gas temperature Tg, radiative temperature Tr, and dust temperature Td. All properties are drawn vs the stellar radius R* (lower axis) and astronomical units (AU; upper axis). The grey horizontal lines are guides.
Current usage metrics show cumulative count of Article Views (full-text article views including HTML views, PDF and ePub downloads, according to the available data) and Abstracts Views on Vision4Press platform.
Data correspond to usage on the plateform after 2015. The current usage metrics is available 48-96 hours after online publication and is updated daily on week days.
Initial download of the metrics may take a while.