Fig. 4.
Download original image
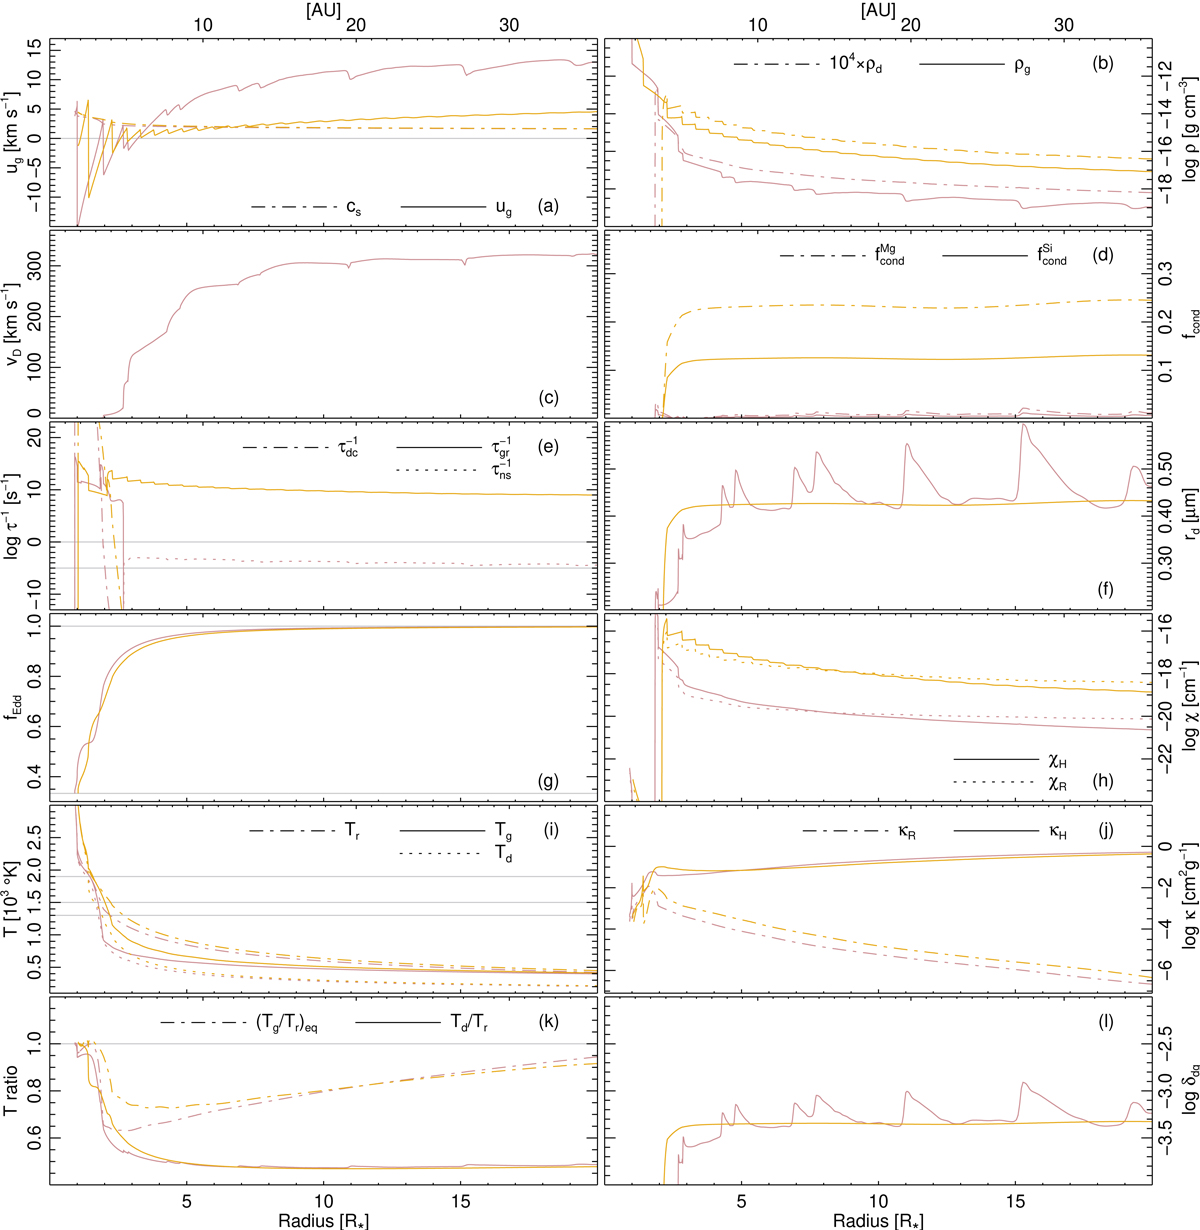
Radial structure of snapshot of set-up L3.85T27 for the full modelled region. Shown are the drift model, where ξ(Fo) = 0.1 (purple), and the PC model, where ξ(Fo) = 1.0 (orange). From the top left, the 12 panels show: (a) gas velocity ug, sound speed cs; (b) gas density ρg, dust density 104 × ρd (log); (c) drift velocity vD; (d) true degree of condensation of silicon ![]() and magnesium
and magnesium ![]() ; (e) net growth rate
; (e) net growth rate ![]() , net decay rate
, net decay rate ![]() , and non-thermal sputtering
, and non-thermal sputtering ![]() (log) times nd,FodV (where dV is the cell volume); (f) average grain radius rd; (g) Eddington factor fEdd; (h) extinction coefficient χH, Rosseland mean extinction coefficient χR; (i) gas temperature Tg, radiative temperature Tr, and dust temperature Td; (j) gas opacity κH and Rosseland mean opacity κR (log); (k) temperature ratios Td/Tr and (Tg/Tr)eq; and (l) dust-to-gas density ratio δdg. All properties are drawn vs the stellar radius R* (lower axis) and astronomical units (AU; upper axis). The grey horizontal lines are guides.
(log) times nd,FodV (where dV is the cell volume); (f) average grain radius rd; (g) Eddington factor fEdd; (h) extinction coefficient χH, Rosseland mean extinction coefficient χR; (i) gas temperature Tg, radiative temperature Tr, and dust temperature Td; (j) gas opacity κH and Rosseland mean opacity κR (log); (k) temperature ratios Td/Tr and (Tg/Tr)eq; and (l) dust-to-gas density ratio δdg. All properties are drawn vs the stellar radius R* (lower axis) and astronomical units (AU; upper axis). The grey horizontal lines are guides.
Current usage metrics show cumulative count of Article Views (full-text article views including HTML views, PDF and ePub downloads, according to the available data) and Abstracts Views on Vision4Press platform.
Data correspond to usage on the plateform after 2015. The current usage metrics is available 48-96 hours after online publication and is updated daily on week days.
Initial download of the metrics may take a while.