Open Access
Fig. 2
Download original image
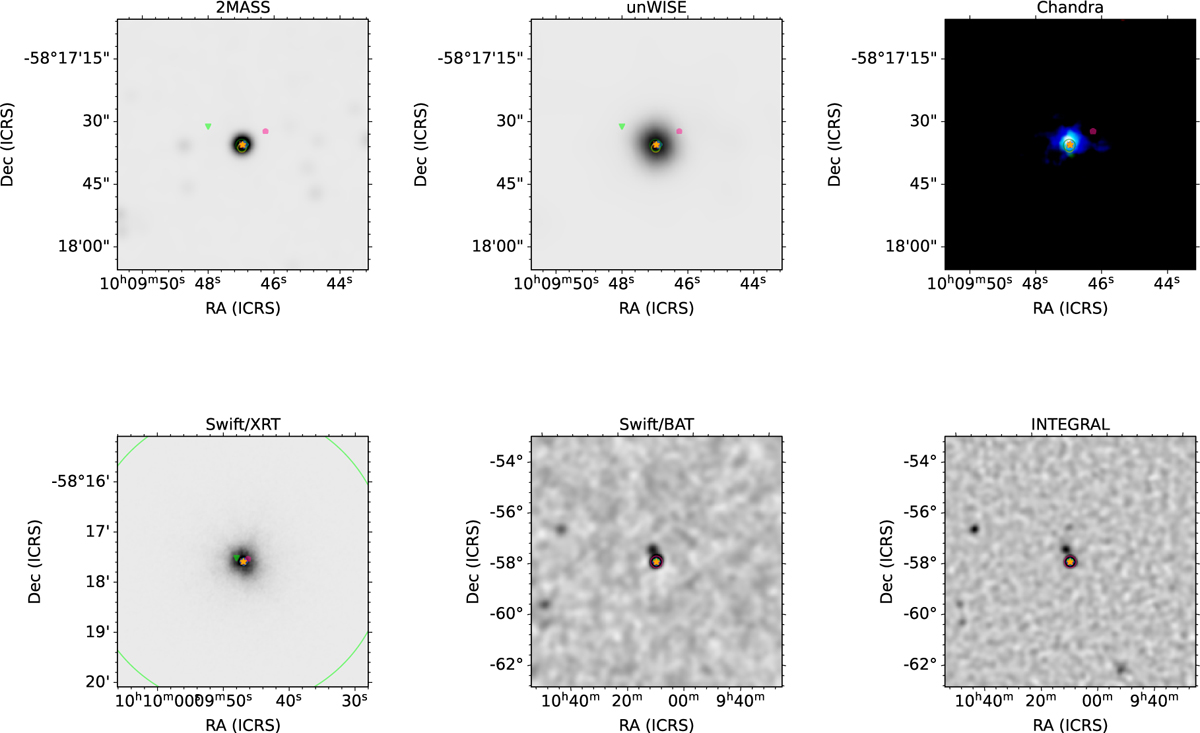
Finding charts of GRO J1008^57. The finding charts are overlaid with symbols and error circles to indicate observations of different instruments. See text in Sect. 3.2 for an explanation of the finding charts and the symbols.
Current usage metrics show cumulative count of Article Views (full-text article views including HTML views, PDF and ePub downloads, according to the available data) and Abstracts Views on Vision4Press platform.
Data correspond to usage on the plateform after 2015. The current usage metrics is available 48-96 hours after online publication and is updated daily on week days.
Initial download of the metrics may take a while.