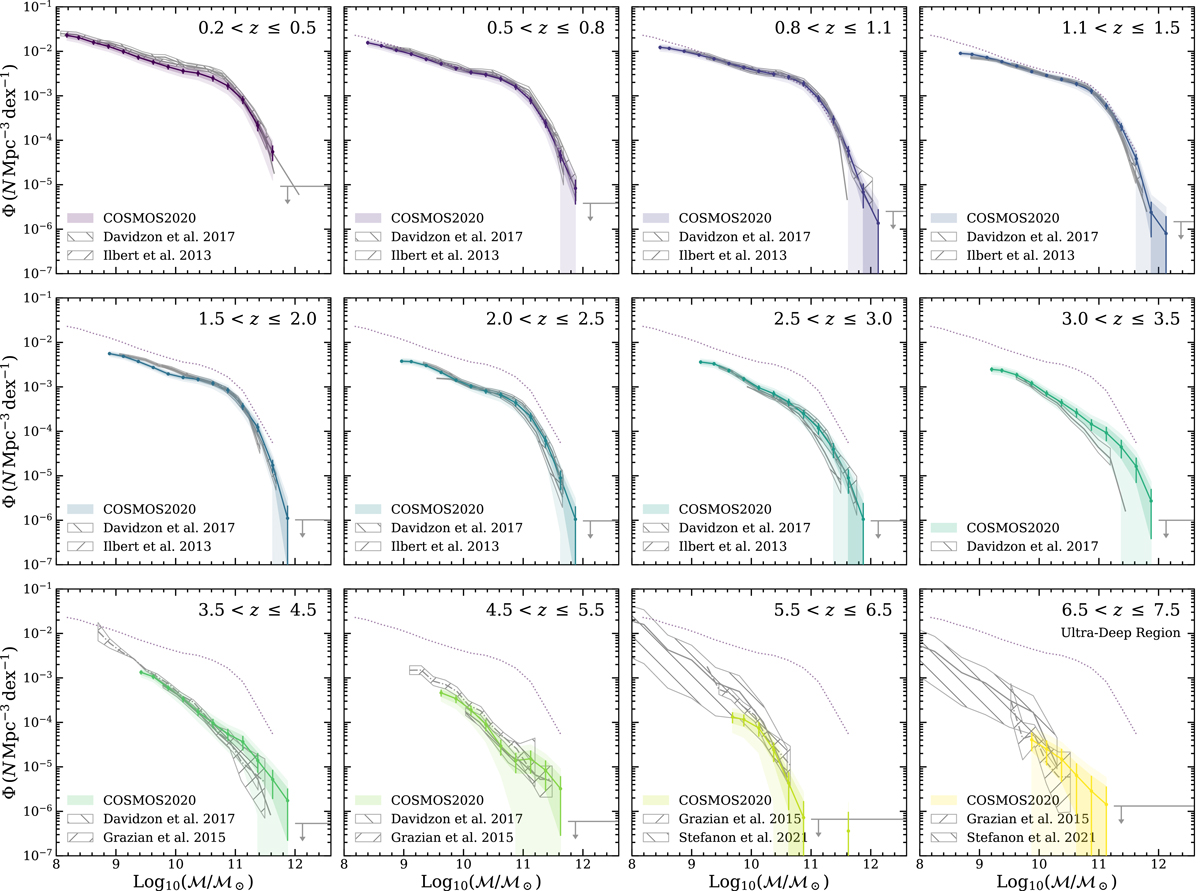
Fig. 6.
Download original image
Evolution of the galaxy stellar mass function across 12 redshift bins (0.2 < z ≤ 7.5). The 0.2 < z ≤ 0.5 SMF from the first redshift bin is repeated in each panel for reference shown by the purple dotted curve. Two other COSMOS stellar mass functions from Ilbert et al. (2013) and Davidzon et al. (2017) are shown for comparison, along with Grazian et al. (2015) from UDS/GOODS-S/HUDF and the recent work of Stefanon et al. (2021) from GREATS at z > 6. Mass incomplete measurements are not shown. Upper limits for empty bins are shown by the horizontal gray line with an arrow.
Current usage metrics show cumulative count of Article Views (full-text article views including HTML views, PDF and ePub downloads, according to the available data) and Abstracts Views on Vision4Press platform.
Data correspond to usage on the plateform after 2015. The current usage metrics is available 48-96 hours after online publication and is updated daily on week days.
Initial download of the metrics may take a while.