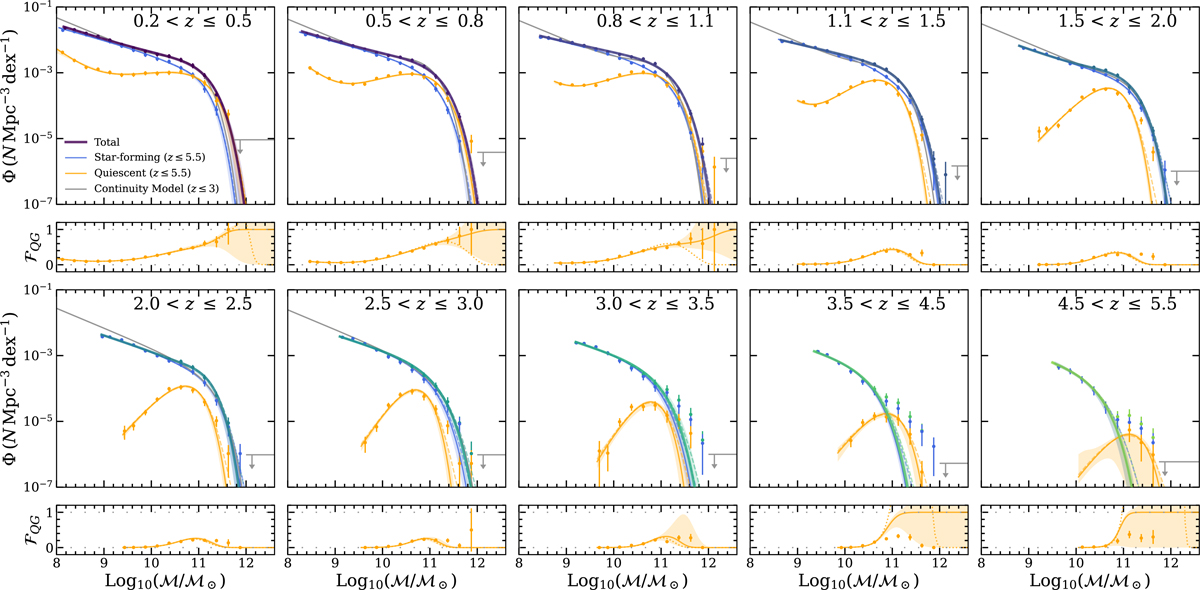
Fig. C.4.
Download original image
Best fit Schechter models corresponding to maximum likelihood for the total, star-forming, and quiescent samples (solid colored curves) based on the observed data (colored points). Fits for the median posterior will be similar for symmetric parameter posterior distributions, which are found in all but the last bin shown here. Kernel convolved fits are shown by the dashed curves. Fits measured using the continuity model are shown in gray solid curves. Lower panels indicate the fraction of quiescent galaxies ℱQG ≡ ΦQG/(ΦSF + ΦQG) as a function of log10(ℳ/ℳ⊙) for the data (colored points) and maximum likelihood fits (solid curve). Since the star-forming and quiescent fits are not required to sum to the total fit, changing the definition to ℱQG ≡ ΦQG/ΦTotal as reported by Ilbert et al. (2013) and Davidzon et al. (2017) produces the dotted curves with noticeably lower ℱQG at high ℳ.
Current usage metrics show cumulative count of Article Views (full-text article views including HTML views, PDF and ePub downloads, according to the available data) and Abstracts Views on Vision4Press platform.
Data correspond to usage on the plateform after 2015. The current usage metrics is available 48-96 hours after online publication and is updated daily on week days.
Initial download of the metrics may take a while.