Fig. B.2.
Download original image
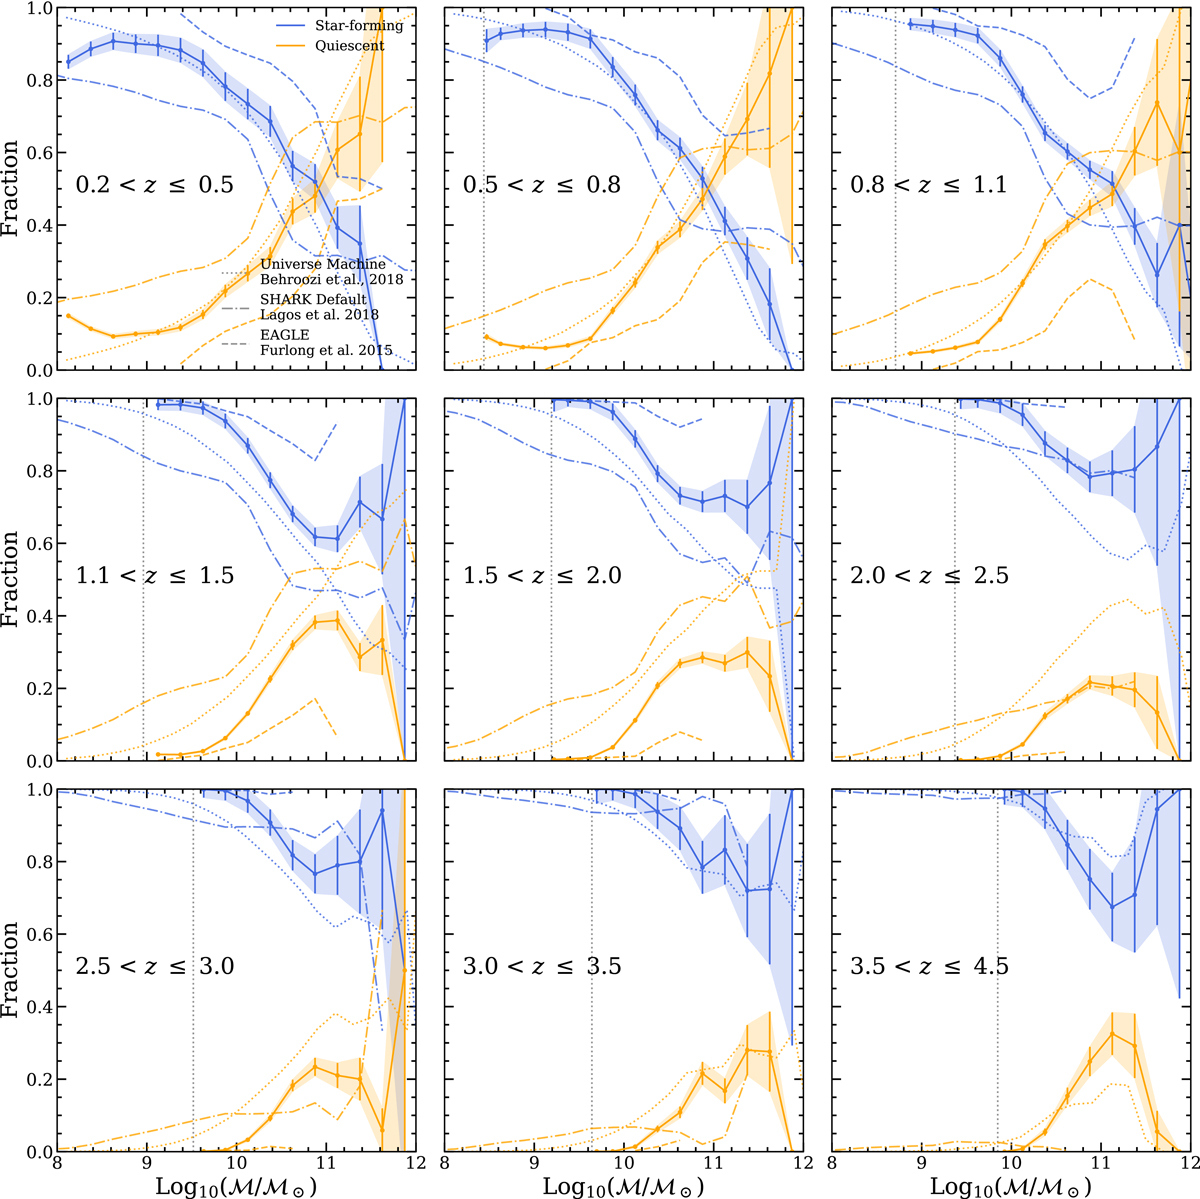
Fraction of star-forming (blue) and quiescent (orange) galaxy samples as a function of mass at for three redshift ranges compared to simulations. We include measurements from UNIVERSE MACHINE Behroozi et al. (2019, sSFR < 10−11 ℳ⊙ yr−1) shown by dotted lines, as well as those from consistently NUVrJ-selected samples from EAGLE (Furlong et al. 2015) and SHARK (Lagos et al. 2018).
Current usage metrics show cumulative count of Article Views (full-text article views including HTML views, PDF and ePub downloads, according to the available data) and Abstracts Views on Vision4Press platform.
Data correspond to usage on the plateform after 2015. The current usage metrics is available 48-96 hours after online publication and is updated daily on week days.
Initial download of the metrics may take a while.