Fig. 17.
Download original image
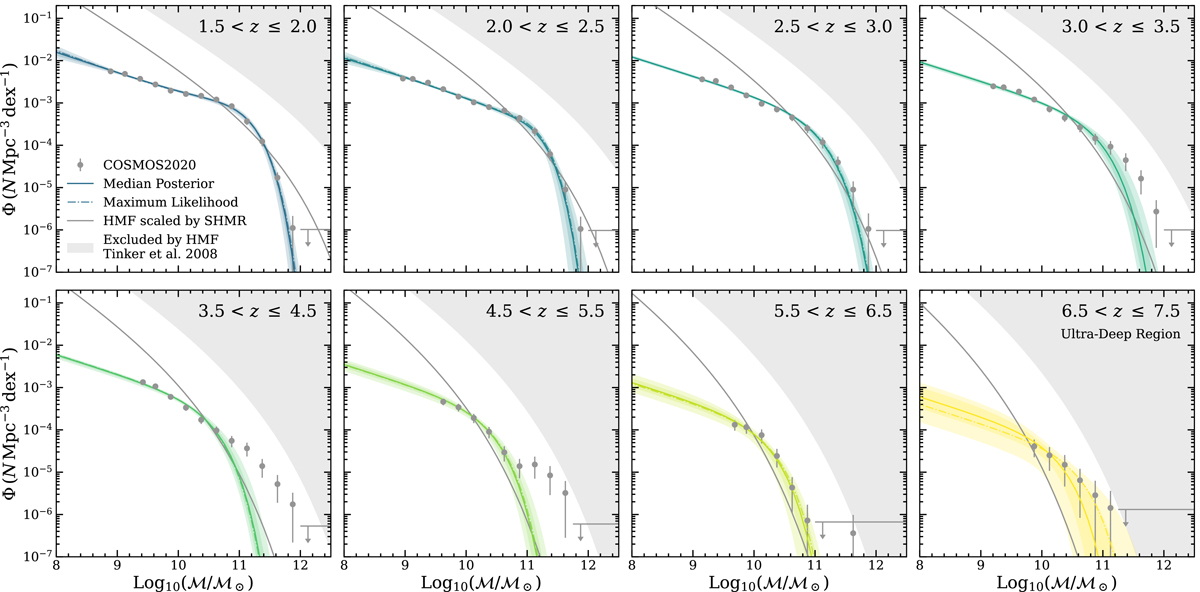
Comparison of the inferred z > 1.5 galaxy stellar mass function (colored curve with 1 and 2σ envelopes) fitted to observed measurements (gray points). We scale the Tinker et al. (2008) halo mass function (HMF; lower bound of the gray shaded region) by 0.018 corresponding to the stellar-to-halo mass relation at z = 0 and ![]() (Behroozi et al. 2013) to produce an idealized SMF (gray curve). Upper limits on the SMF at each redshift are derived from the HMF assuming a fixed baryon fraction (0.166). Upper limits for empty bins are shown by the horizontal gray line with an arrow. Mass incomplete measurements are not shown.
(Behroozi et al. 2013) to produce an idealized SMF (gray curve). Upper limits on the SMF at each redshift are derived from the HMF assuming a fixed baryon fraction (0.166). Upper limits for empty bins are shown by the horizontal gray line with an arrow. Mass incomplete measurements are not shown.
Current usage metrics show cumulative count of Article Views (full-text article views including HTML views, PDF and ePub downloads, according to the available data) and Abstracts Views on Vision4Press platform.
Data correspond to usage on the plateform after 2015. The current usage metrics is available 48-96 hours after online publication and is updated daily on week days.
Initial download of the metrics may take a while.