Fig. 15.
Download original image
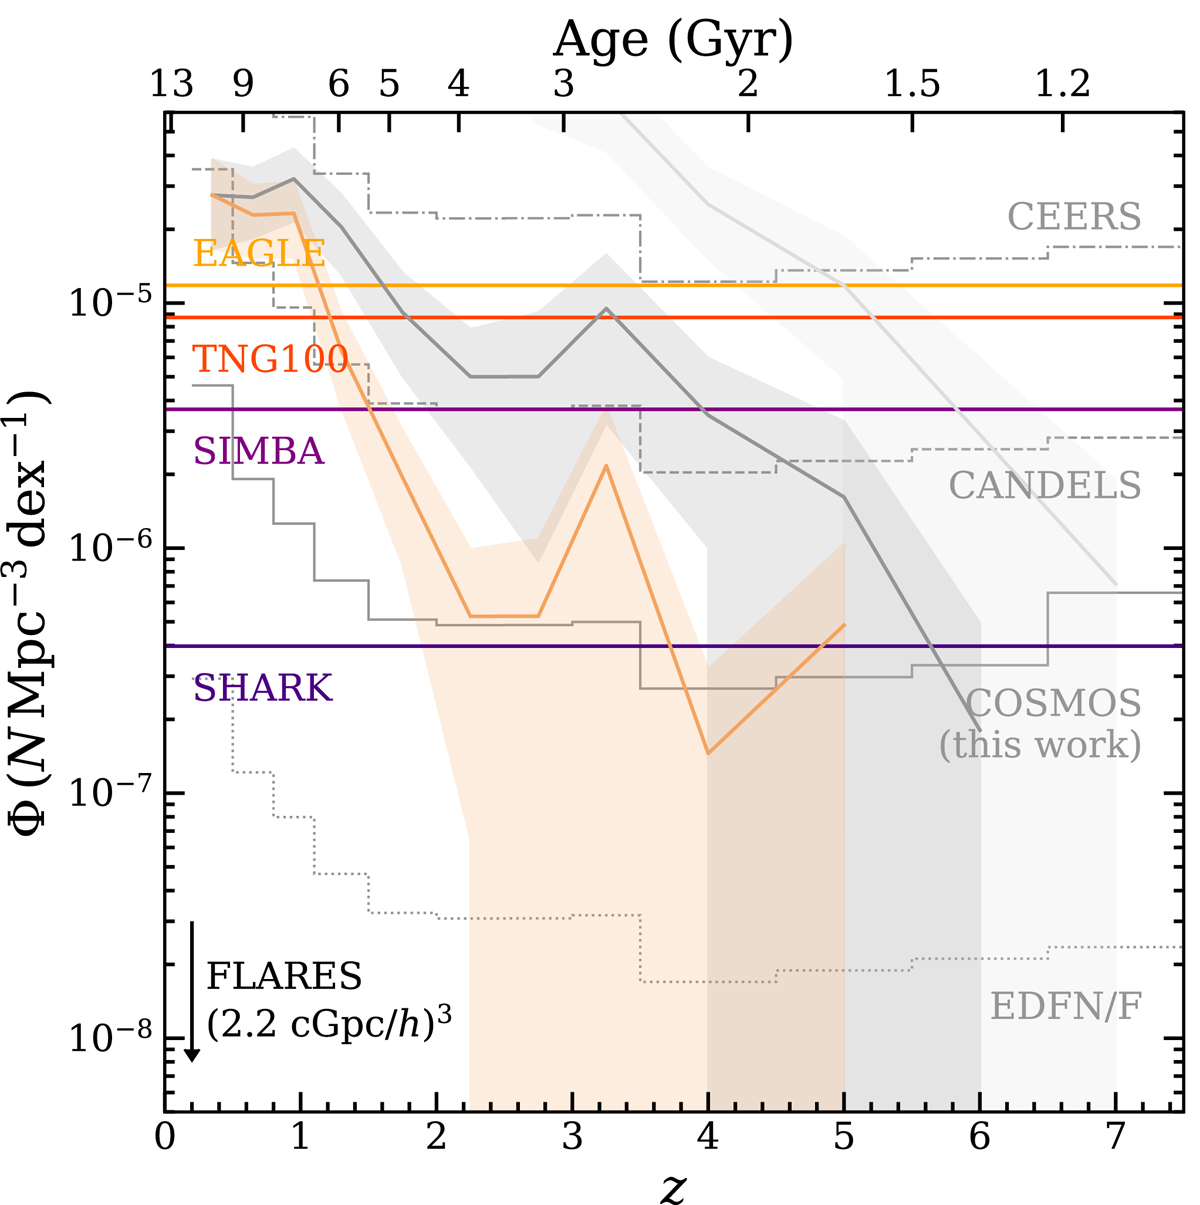
Comparison of observed number densities and upper limits on the rarity probed by various observed (gray steps) and simulated (colored lines) volumes. Number densities correspond to 1011.0 < ℳ < 1011.5 ℳ⊙ and 1011.5ℳ < 1012.0 ℳ⊙ from the total sample (light and dark gray, respectively), and 1011.5ℳ < 1012.0 ℳ⊙ from the quiescent sample (orange) from Fig. 8. 1σ upper limits are computed following Gehrels (1986), which for the observed volumes are dependent on widths of redshift bins.
Current usage metrics show cumulative count of Article Views (full-text article views including HTML views, PDF and ePub downloads, according to the available data) and Abstracts Views on Vision4Press platform.
Data correspond to usage on the plateform after 2015. The current usage metrics is available 48-96 hours after online publication and is updated daily on week days.
Initial download of the metrics may take a while.