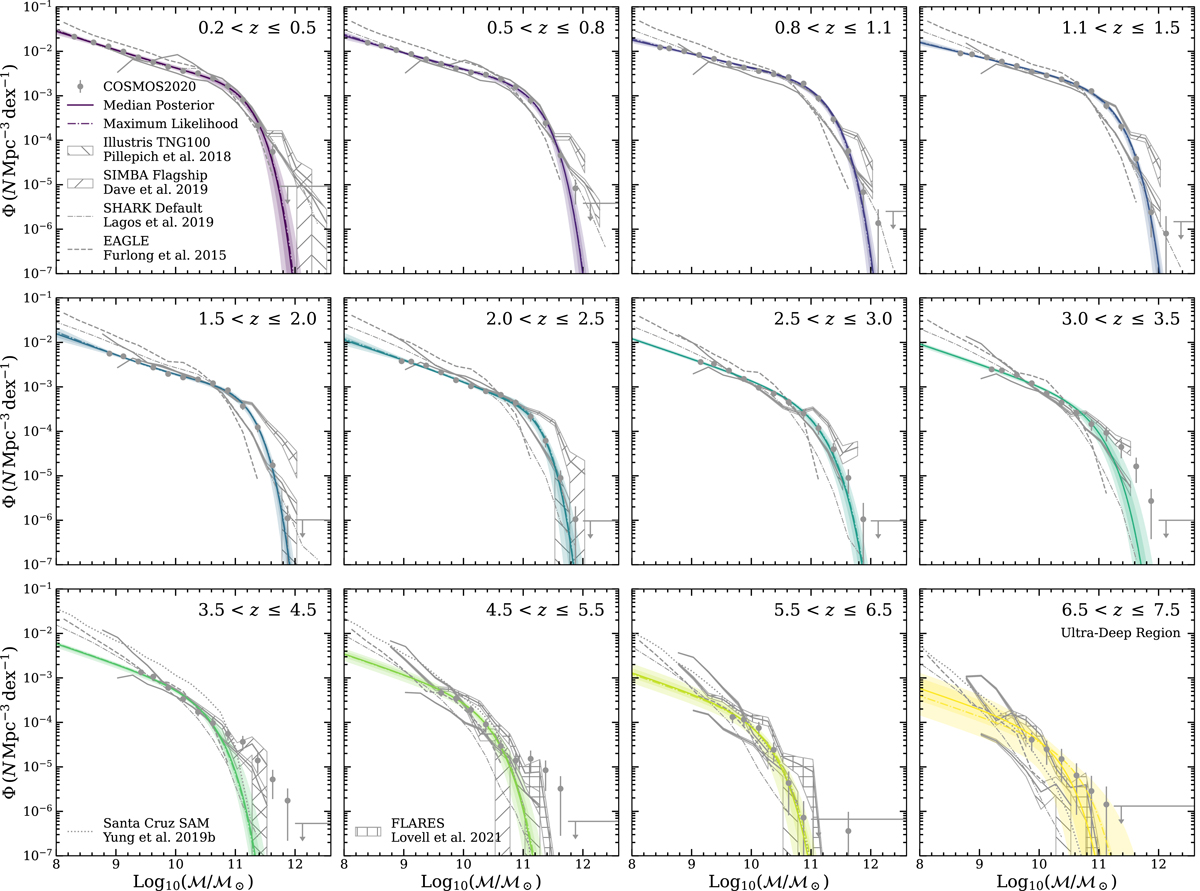
Fig. 13.
Download original image
Comparison of observed and inferred galaxy stellar mass function (gray points, and colored curve with 1 and 2σ envelopes, respectively) to the reference flavors of four simulations: TNG100 of the ILLUSTRISTNG project (Pillepich et al. 2018), EAGLE (Furlong et al. 2015), SHARK (Default; Lagos et al. 2018), SANTA CRUZ (Yung et al. 2019a,b), and SIMBA (Flagship; Davé et al. 2019). To note, we do not apply any artificial normalization to any model or observation. Upper limits for empty bins are shown by the horizontal gray line with an arrow. Mass incomplete measurements are not shown.
Current usage metrics show cumulative count of Article Views (full-text article views including HTML views, PDF and ePub downloads, according to the available data) and Abstracts Views on Vision4Press platform.
Data correspond to usage on the plateform after 2015. The current usage metrics is available 48-96 hours after online publication and is updated daily on week days.
Initial download of the metrics may take a while.