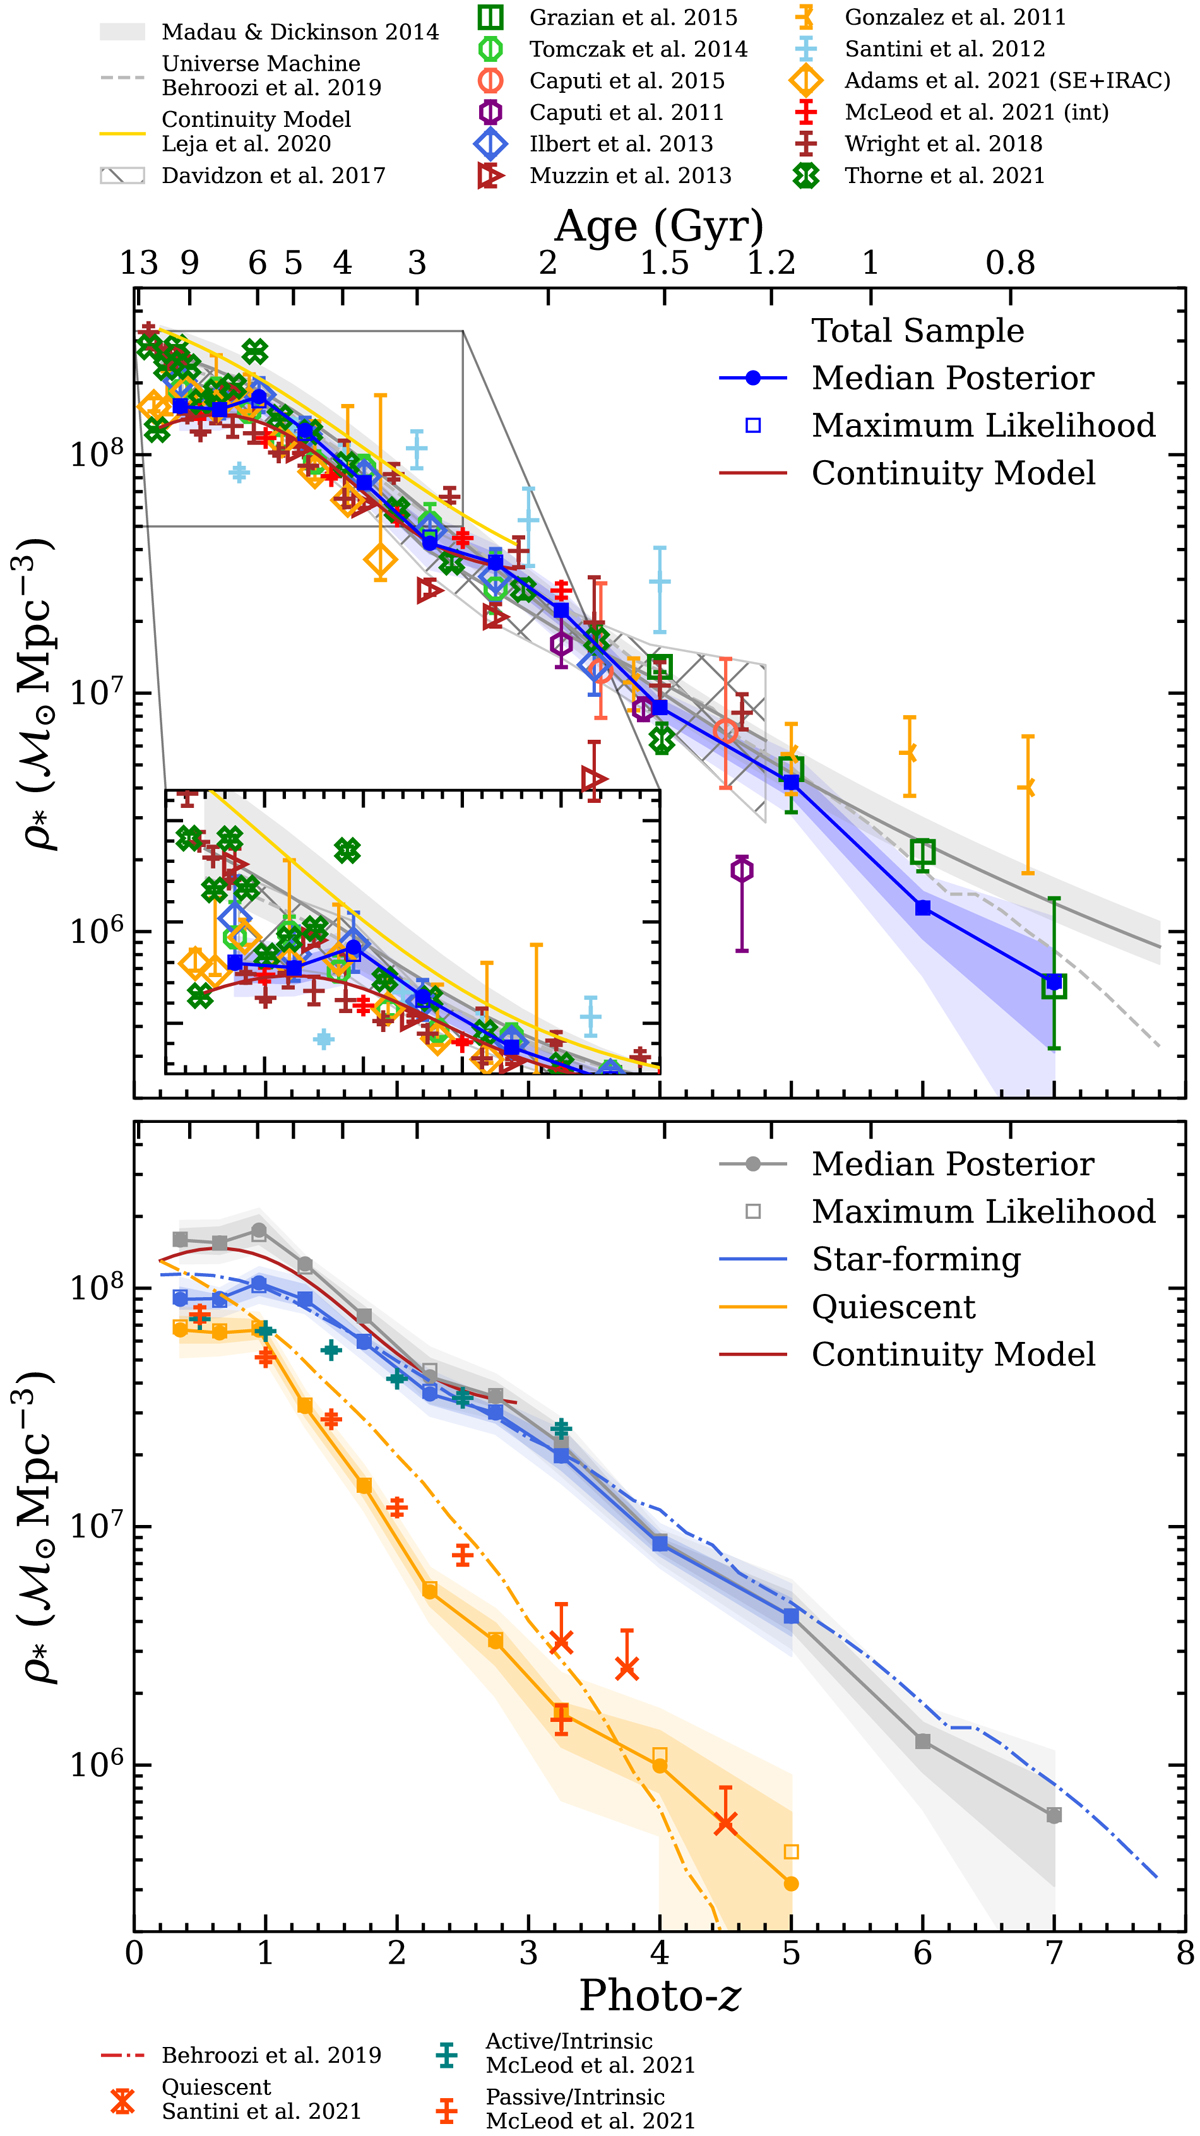
Fig. 12.
Download original image
0.2 < z ≤ 7.5 cosmic stellar mass density. Upper: evolution of the cosmic stellar mass density of the total sample computed from the best-fit likelihood models (blue) integrated above 108 ℳ⊙. Literature results from observational studies of mass-selected samples (Grazian et al. 2015; Tomczak et al. 2014; Caputi et al. 2015, 2011; Ilbert et al. 2013; Muzzin et al. 2013; Santini et al. 2012; Adams et al. 2021; McLeod et al. 2021; Wright et al. 2018; Thorne et al. 2021) and mass inferred from rest UV measurements (González et al. 2011). By integrating their SFRD functions, we can plot ρ* from Behroozi et al. (2013) and Madau & Dickinson (2014). In both cases we assume a return fraction of 41% (based on Chabrier’s IMF, see Sect. 6.1 of Ilbert et al. 2010). For Madau & Dickinson (2014), we include a shaded area based on return fractions between 25 and 50% (the latter value is similar to the one given by Salpeter’s IMF). Lower: evolution of the cosmic stellar mass density of the total (gray, repeated from above), star-forming (light blue), and quiescent (orange) samples compared to literature measurements (Behroozi et al. 2019; Santini et al. 2021; McLeod et al. 2021).
Current usage metrics show cumulative count of Article Views (full-text article views including HTML views, PDF and ePub downloads, according to the available data) and Abstracts Views on Vision4Press platform.
Data correspond to usage on the plateform after 2015. The current usage metrics is available 48-96 hours after online publication and is updated daily on week days.
Initial download of the metrics may take a while.