Fig. 9
Download original image
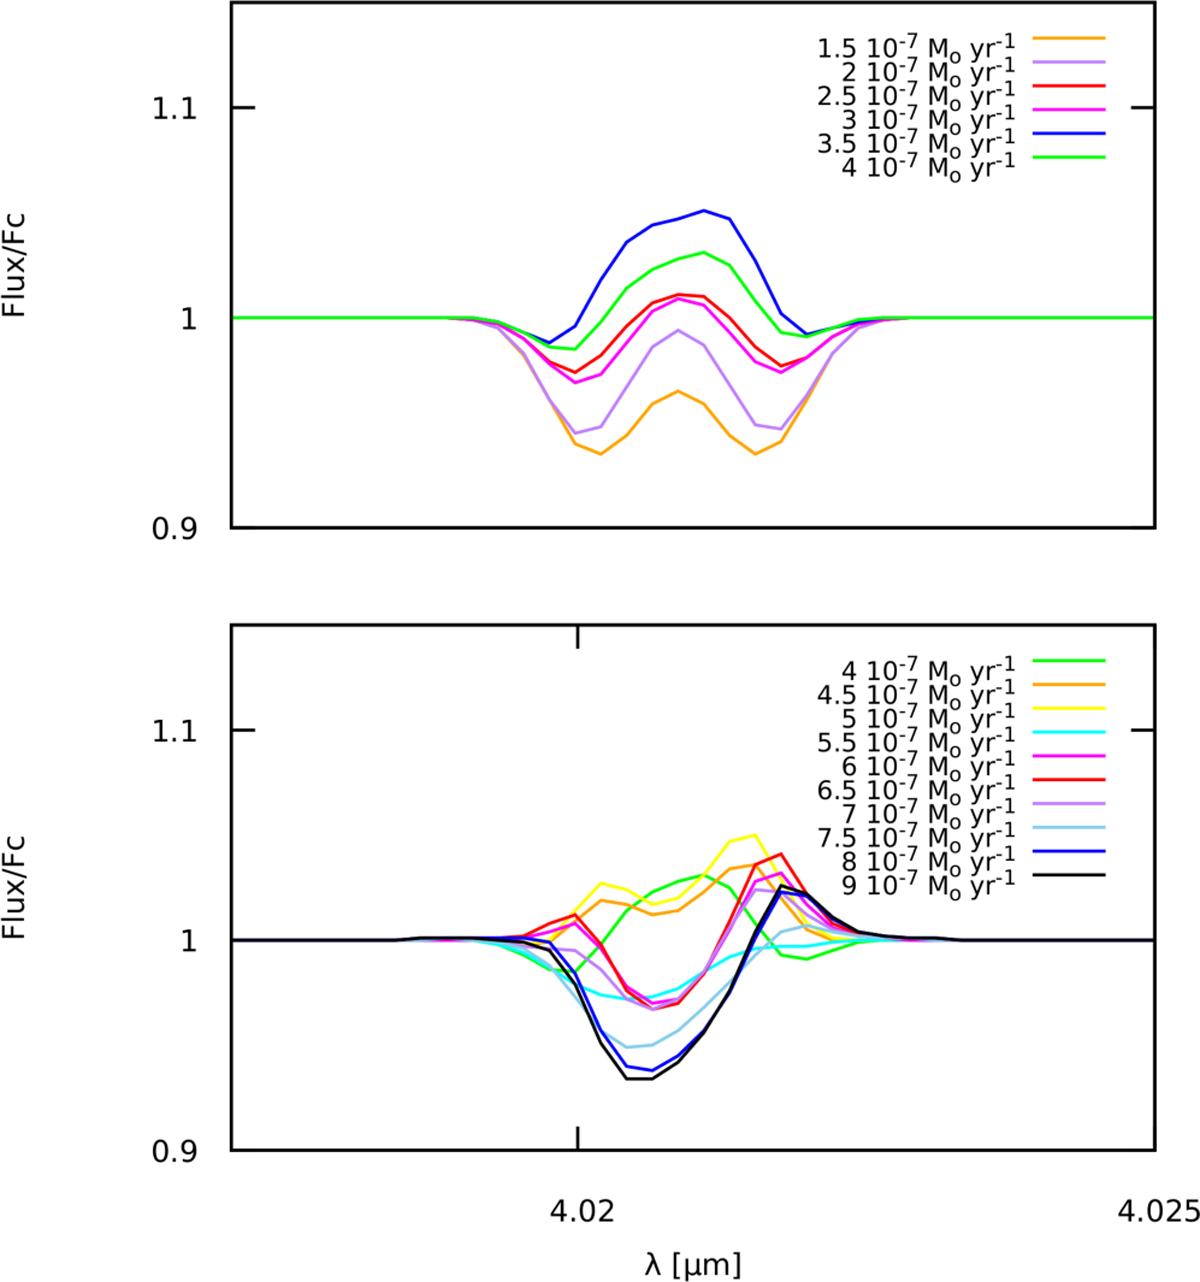
Response of the line Hu14 to the mass-loss rate. Top panel: As the mass-loss increases, the line changes from an absorption profile to a single-peaked emission. The mass-loss interval goes from 1.5 × 10⁻⁷ M⊙ yr−1 to 4 × 10⁻⁷ M⊙ yr−1, in a step of 0.5 × 10⁻⁷ M⊙ yr−1. The maximum intensity of the single-peaked emission is achieved when Ṁ = 3.5 × 10⁻⁷ M⊙ yr−1 (solid blue line), and then the intensity decreases (solid green line). Bottom panel: Synthetic double-peaked-profiles were obtained from 4.5 × 10⁻⁷ M⊙ yr−1 to 7 × 10⁻⁷ M⊙ yr−1. The behaviour is non-monotonic. Then, as the mass loss increases, the profile turns to a P Cygni one (for Ṁ > 7.5 × 10⁻⁷ M⊙ yr−1).
Current usage metrics show cumulative count of Article Views (full-text article views including HTML views, PDF and ePub downloads, according to the available data) and Abstracts Views on Vision4Press platform.
Data correspond to usage on the plateform after 2015. The current usage metrics is available 48-96 hours after online publication and is updated daily on week days.
Initial download of the metrics may take a while.