Open Access
Fig. 8
Download original image
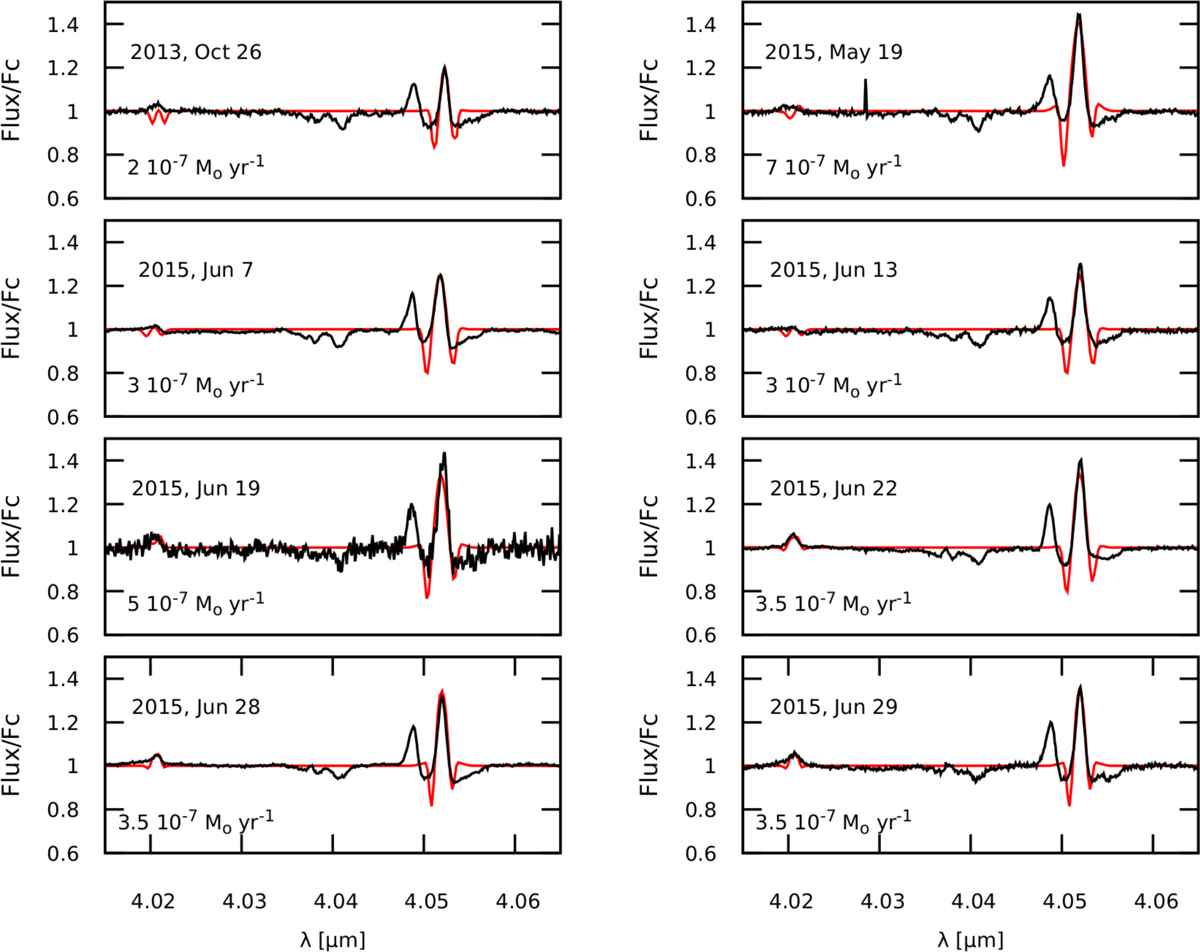
Best-fitting models to the Brα and Hu14 emission observed in 2013 and 2015. Observations are traced in black, and models are in solid red lines. The mass-loss rate used to model the lines is indicated in each plot.
Current usage metrics show cumulative count of Article Views (full-text article views including HTML views, PDF and ePub downloads, according to the available data) and Abstracts Views on Vision4Press platform.
Data correspond to usage on the plateform after 2015. The current usage metrics is available 48-96 hours after online publication and is updated daily on week days.
Initial download of the metrics may take a while.