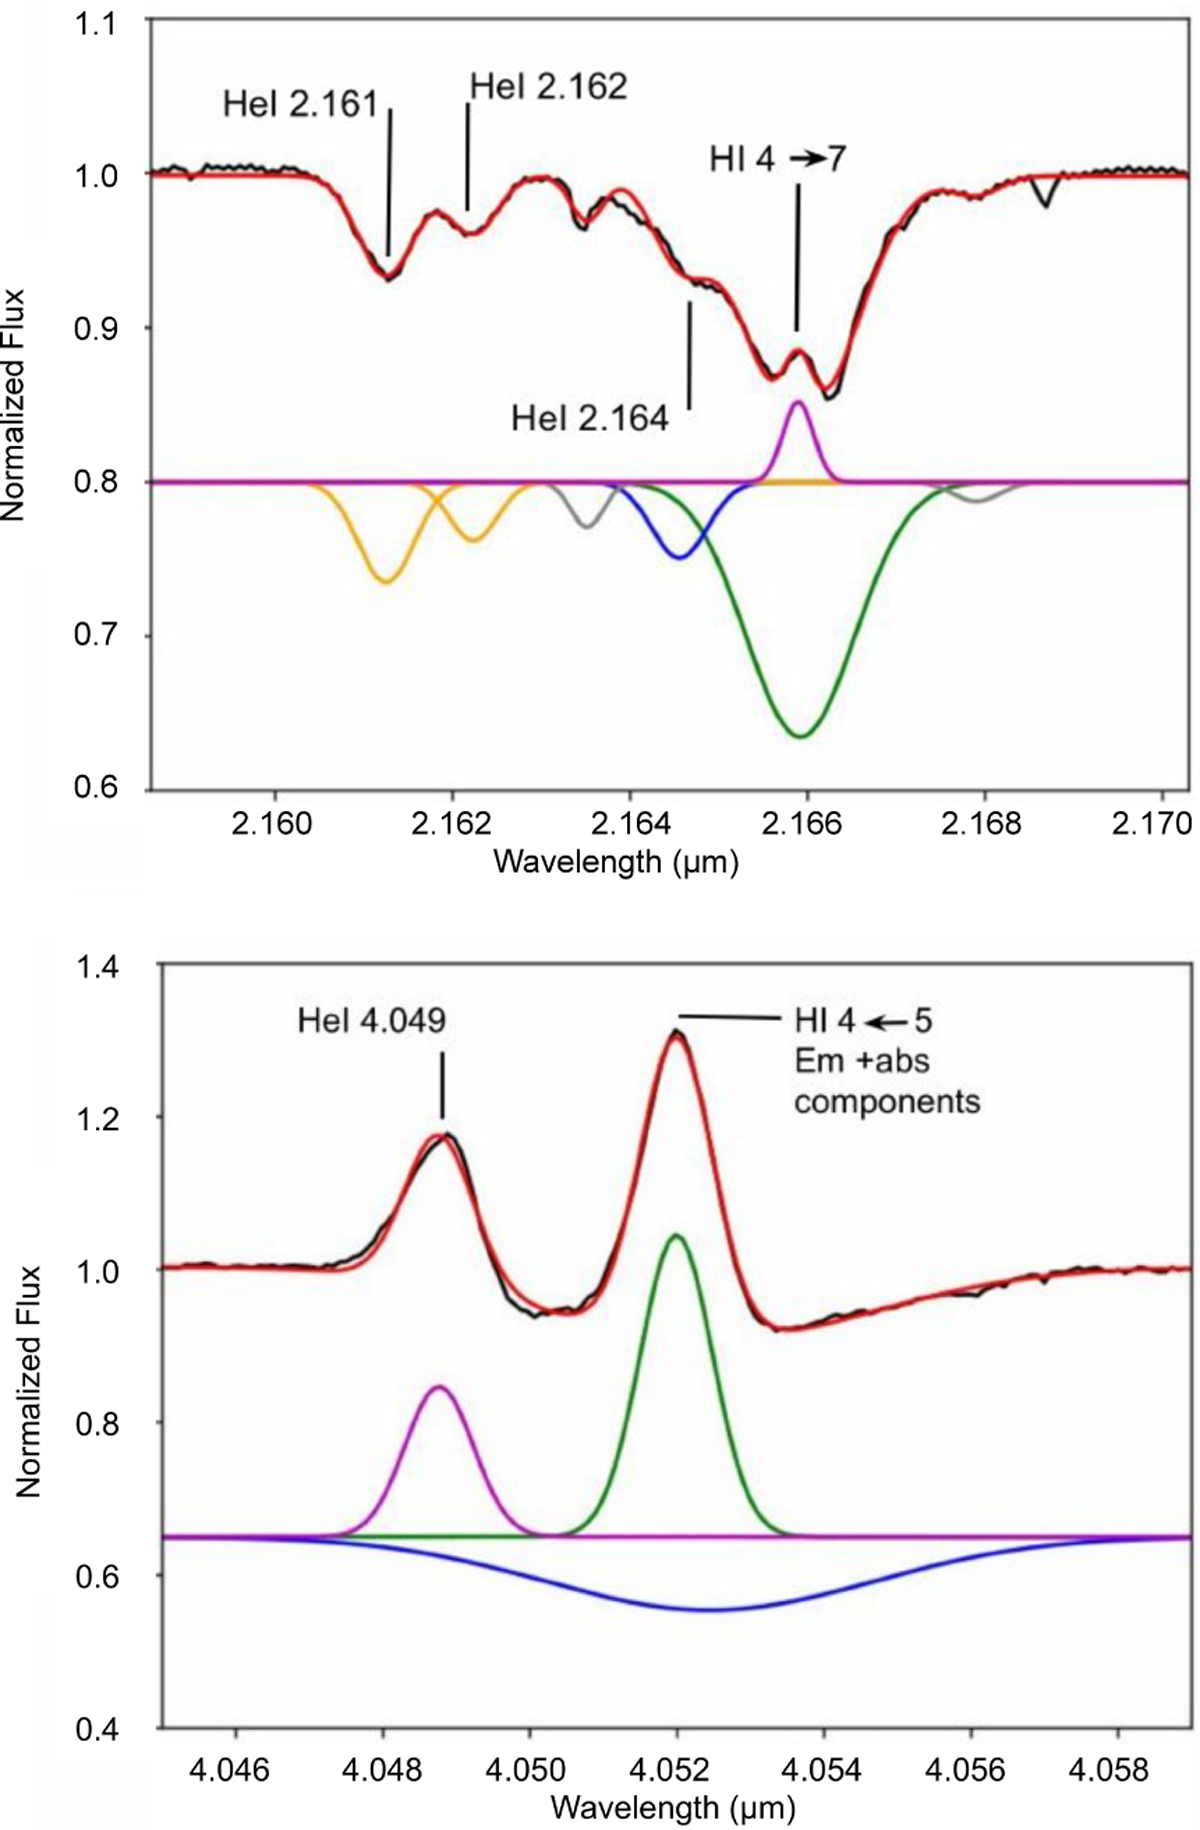
Fig. 2
Download original image
Gaussian fittings to the observed Brγ (H I 4–7, top panel) and Brα (H I 4–5, bottom panel) line profiles that disentangle emission and absorption components. The spectra shown here were taken on June 22 and June 28, 2015, respectively. The fittings combining all contributing Gaussian components (solid red line) are overlaid on the observations in black. The individual Gaussian components used to model the lines are shown with different colours and have been shifted down in the y direction for better visualisation.
Current usage metrics show cumulative count of Article Views (full-text article views including HTML views, PDF and ePub downloads, according to the available data) and Abstracts Views on Vision4Press platform.
Data correspond to usage on the plateform after 2015. The current usage metrics is available 48-96 hours after online publication and is updated daily on week days.
Initial download of the metrics may take a while.