Fig. 11
Download original image
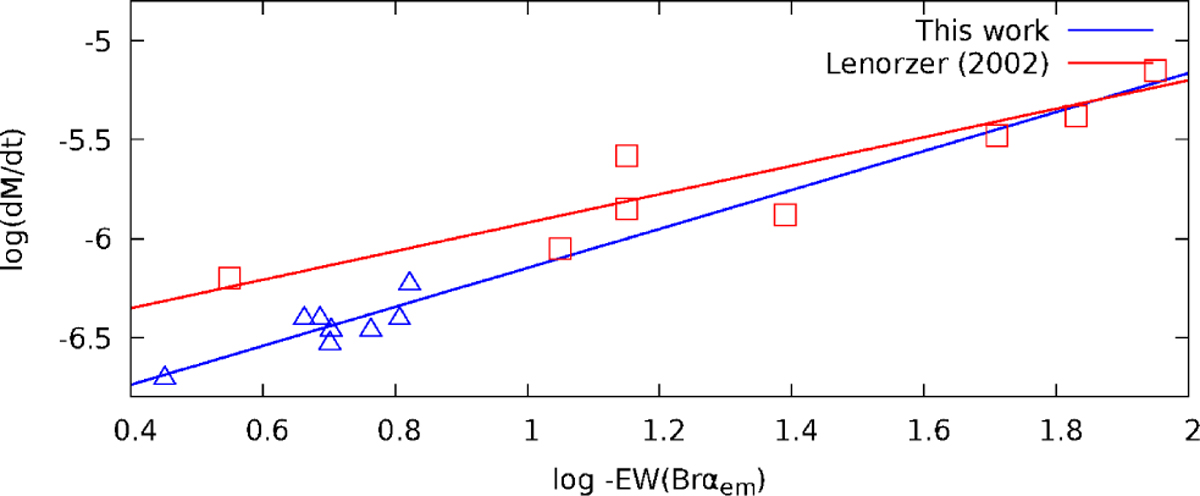
Measured Brα EWs vs. the mass-loss rates of 55 Cyg at different epochs (blue symbols). The linear correlation (blue line) to our data is compared with the relationship found by Lenorzer et al. (2002), which was obtained from ISO spectra of O-type stars and B-type supergiants (red line and square symbols) where the mass-loss rate was obtained from Hα or radio measurements.
Current usage metrics show cumulative count of Article Views (full-text article views including HTML views, PDF and ePub downloads, according to the available data) and Abstracts Views on Vision4Press platform.
Data correspond to usage on the plateform after 2015. The current usage metrics is available 48-96 hours after online publication and is updated daily on week days.
Initial download of the metrics may take a while.