Open Access
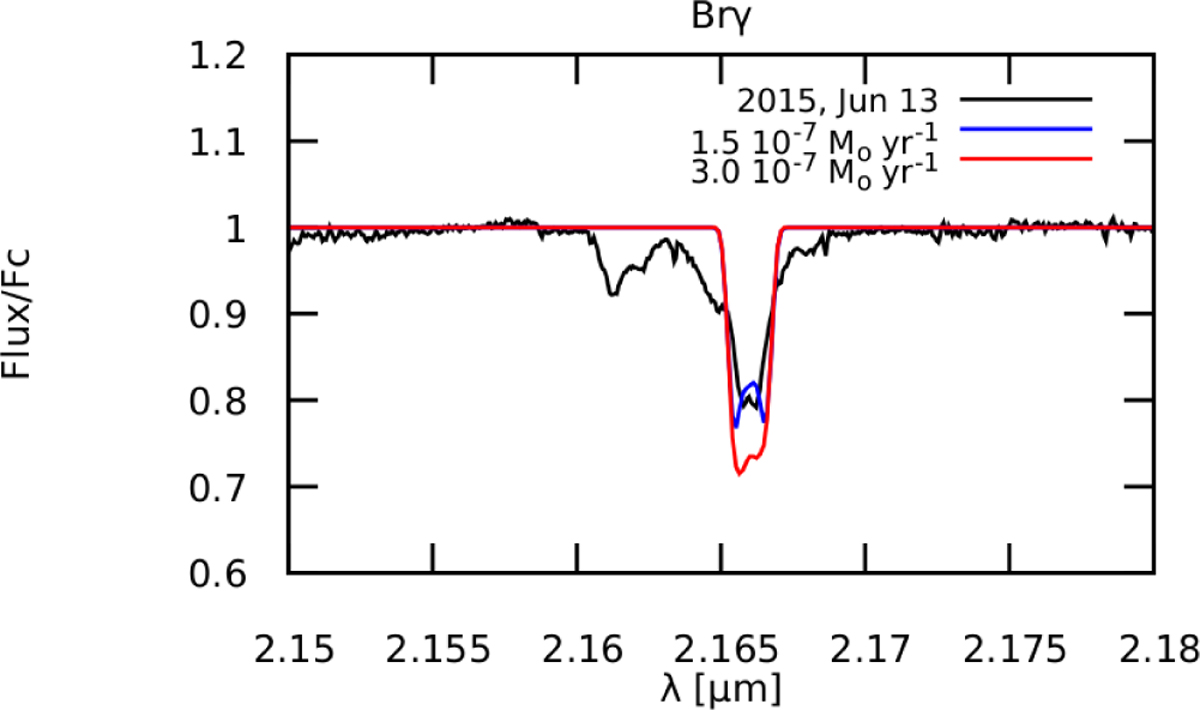
Fig. 10
Download original image
Fittings to the Brγ line profile. When the mass loss increases, the synthetic line profile becomes deeper. The best fitting is obtained with a lower mass-loss rate (Ṁ = 1.5 × 10⁻⁷ M⊙ yr−1). The line is blended with He I λ2.184 µm. Readers can refer to the main text for details.
Current usage metrics show cumulative count of Article Views (full-text article views including HTML views, PDF and ePub downloads, according to the available data) and Abstracts Views on Vision4Press platform.
Data correspond to usage on the plateform after 2015. The current usage metrics is available 48-96 hours after online publication and is updated daily on week days.
Initial download of the metrics may take a while.