Fig. 4
Download original image
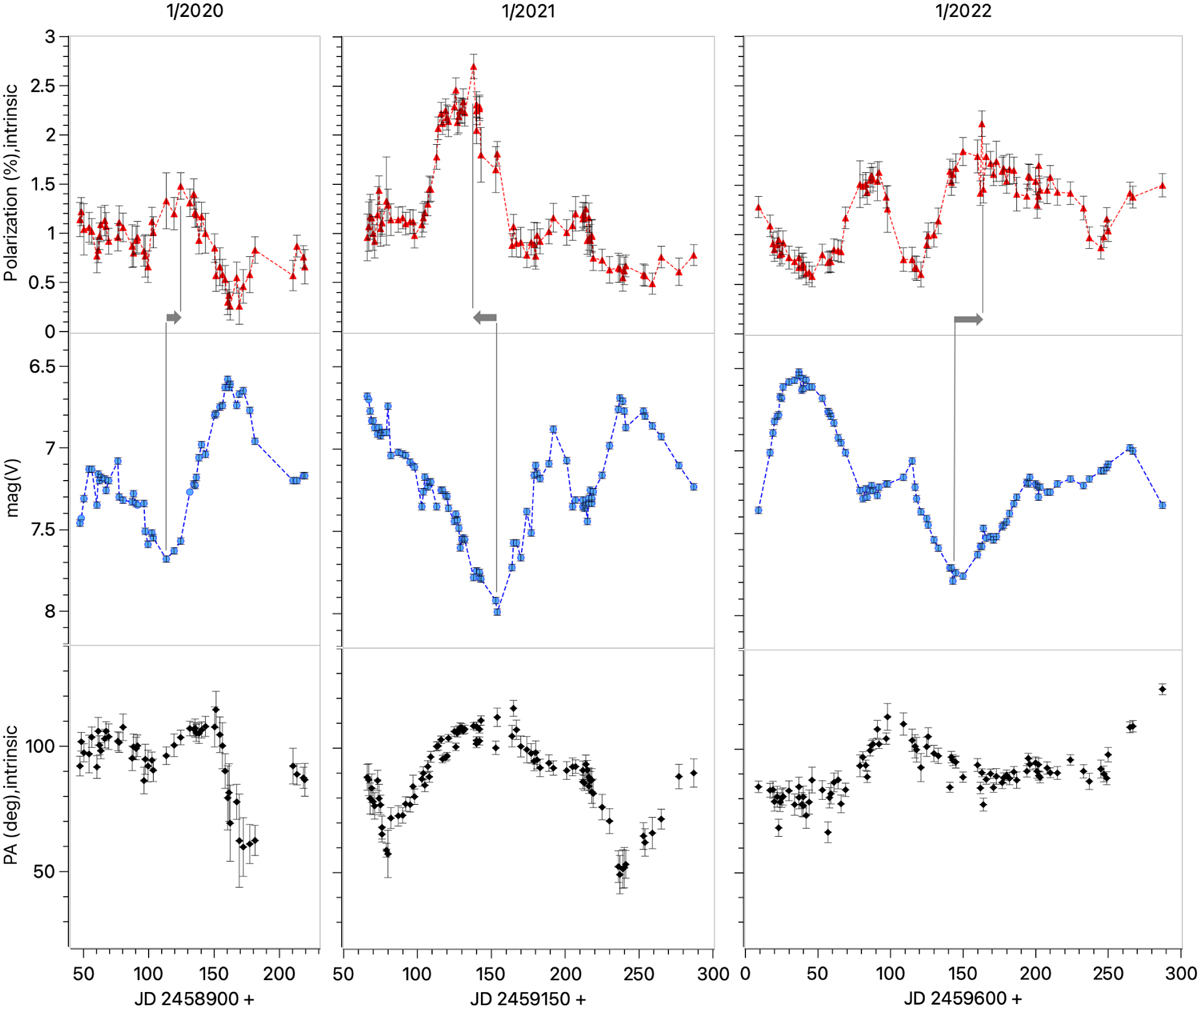
Photopolarimetry of observed pulsation cycles. Intrinsic polarization curves in red are shown in the upper row. The light curves in blue are shown in the middle row. The intrinsic position angle (PA) is shown in the lower row in black. In all three pulsation cycles’ polarization and photometry are generally anticorrelated, and this is especially true around times of brightness maxima and minima. However, the curves are not exactly anti-correlated as indicated by the gray arrows. A phase shift between polarization and total light is most clearly visible around the brightness minimum of pulsation cycle 1/2021, but also seen in pulsation cycles 1/2020 and 1/2022. Comparing between the 3 cycles reveals that the polarization curve can either lead or lag the light curve. The intrinsic PA generally ranges from 80 to 120 degrees, except when the star is brighter than 7 mag(V) and/or the polarization drops significantly below 0.7%. At such times, the PA can drop below 50 degrees.
Current usage metrics show cumulative count of Article Views (full-text article views including HTML views, PDF and ePub downloads, according to the available data) and Abstracts Views on Vision4Press platform.
Data correspond to usage on the plateform after 2015. The current usage metrics is available 48-96 hours after online publication and is updated daily on week days.
Initial download of the metrics may take a while.