Fig. 3
Download original image
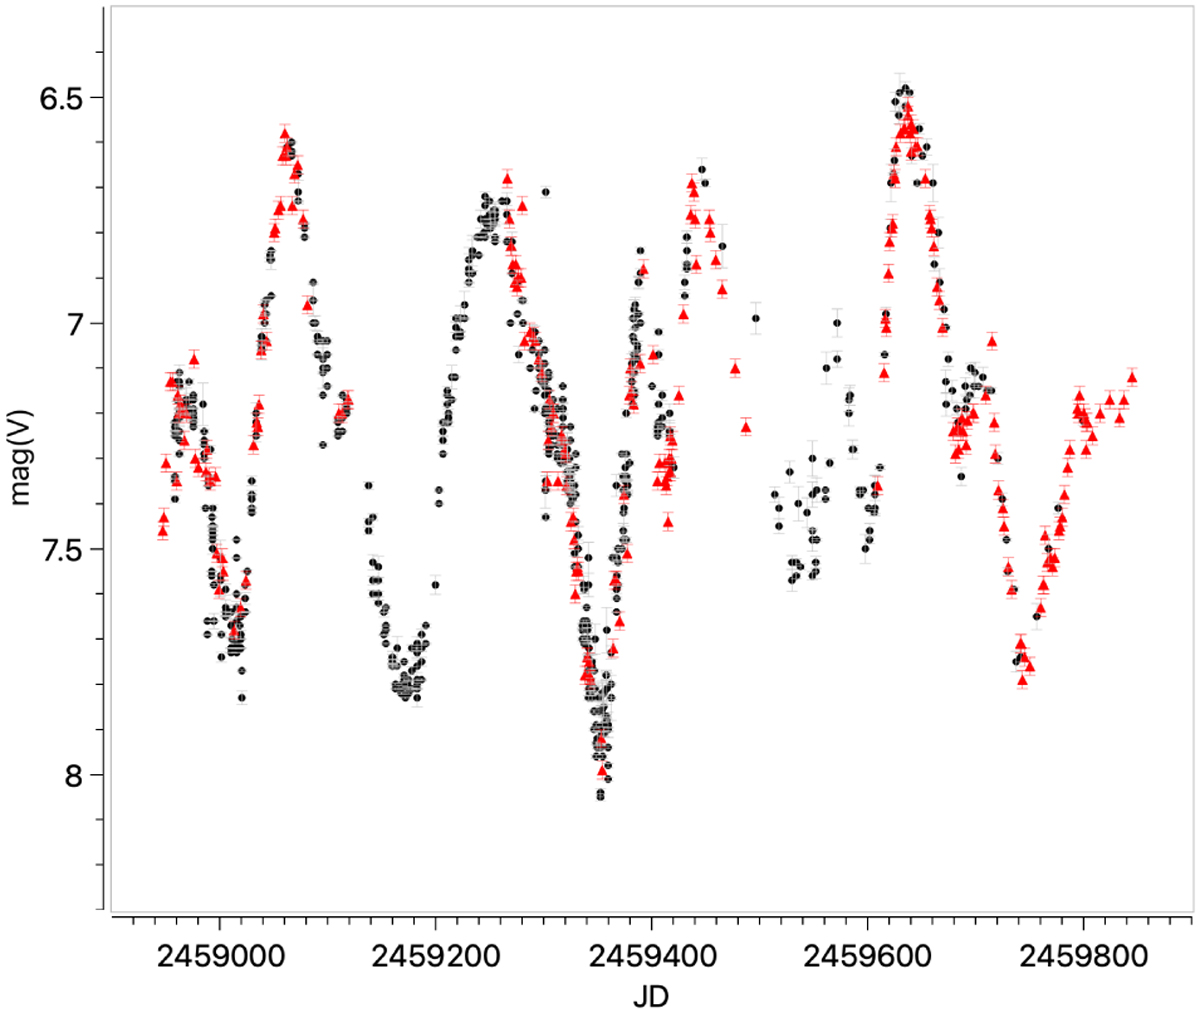
V-band light curve of V CVn from 2020-2022. The red triangles are the photometry measurements provided by Ob1 and Ob2. The gray dots are for AASVO data (CCD measurements only). The three pulsation cycles covered by polarization measurements in this study in red, namely at the left pulsation cycle 1/2020 in the middle 1/2021 and at the right cycle 1/2022. It can be seen that the data from AASVO agrees well with the data measured by Ob1 and Ob2. Pulsation cycle 1/2021 showed the lowest brightness of all minima considered.
Current usage metrics show cumulative count of Article Views (full-text article views including HTML views, PDF and ePub downloads, according to the available data) and Abstracts Views on Vision4Press platform.
Data correspond to usage on the plateform after 2015. The current usage metrics is available 48-96 hours after online publication and is updated daily on week days.
Initial download of the metrics may take a while.