Fig. 9
Download original image
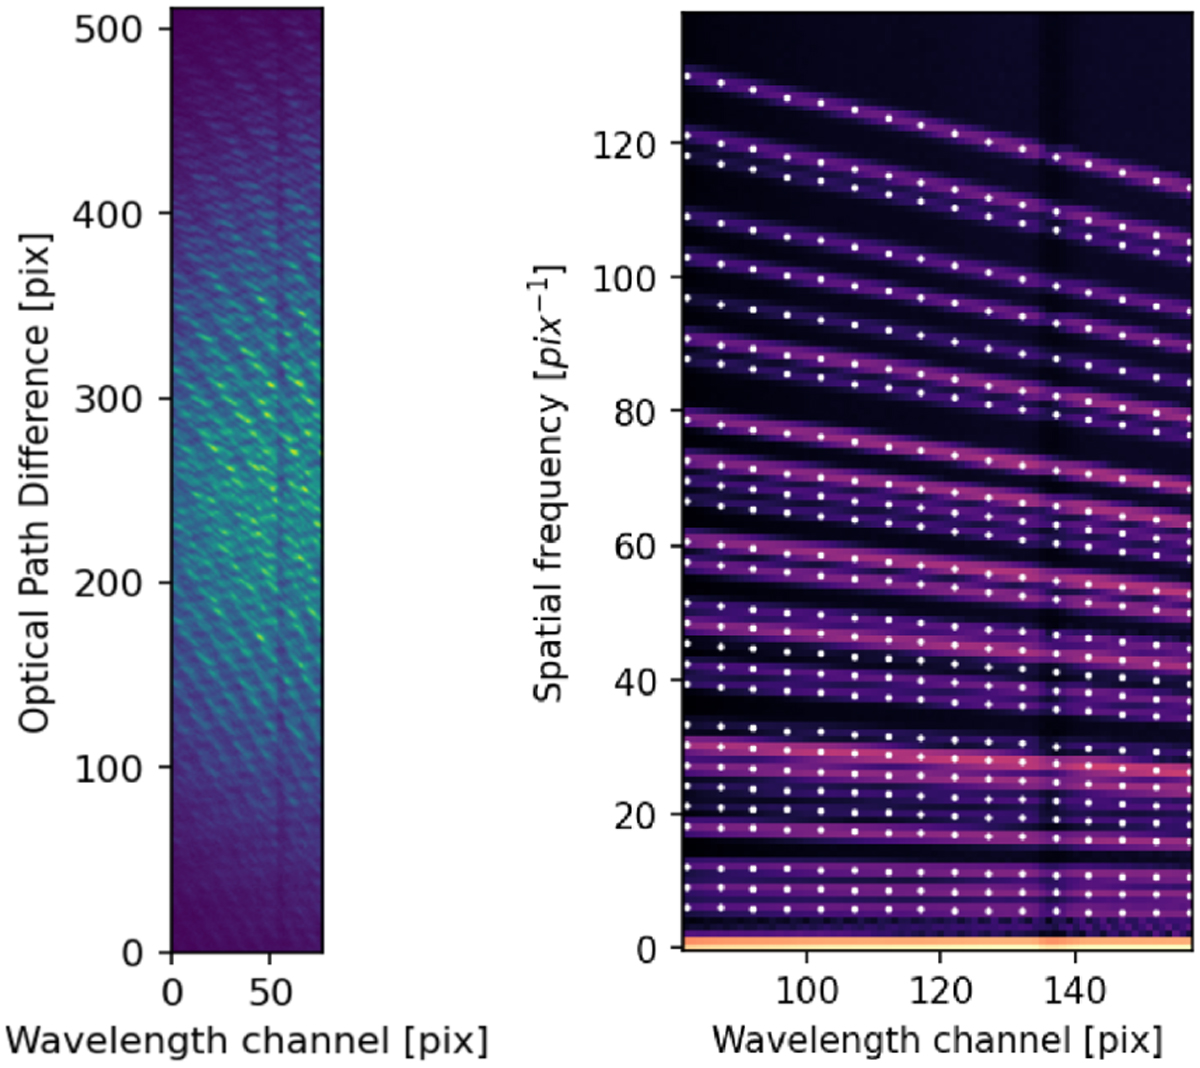
Images delivered by FIRST. Left: Exposure of 100 ms and 50 EMgain of Keho‘oea, corrected from curvature. The vertical dark line around wavelength channel 50 corresponds to the telluric oxygen A band absorption line around 760 to 765 nm. Right: Power spectral density computed from 30 cubes of 100 acquisitions with 100 ms exposure and 50 EMgain. The white dots show the PSD peak fitting for some selected spectral lines.
Current usage metrics show cumulative count of Article Views (full-text article views including HTML views, PDF and ePub downloads, according to the available data) and Abstracts Views on Vision4Press platform.
Data correspond to usage on the plateform after 2015. The current usage metrics is available 48-96 hours after online publication and is updated daily on week days.
Initial download of the metrics may take a while.