Fig. 1.
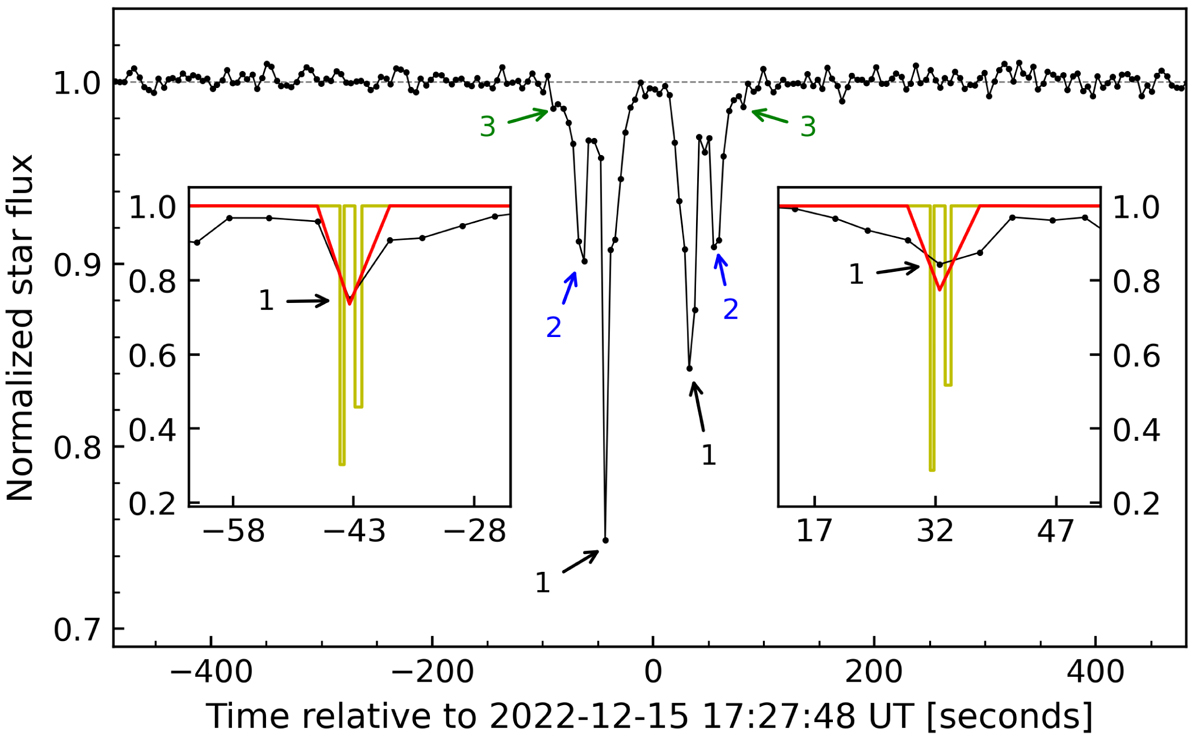
Download original image
Occultation light curve from Kottamia observatory. Flux vs. time is shown in black and the dotted grey line corresponds to a linear fit to the baseline of the light curve. The main symmetric extinction events are indicated with arrows and numbered. The inserts show magnified views around the deepest extinction events (black line) together with a model of the ring structure compatible with the 2011 occultation (gold line), and the model convolved to the time resolution achieved in 2022 (red line). The red line reproduces the maximum drops but not the rest of the curve, indicating more material around Chiron in 2022 than in 2011. See text.
Current usage metrics show cumulative count of Article Views (full-text article views including HTML views, PDF and ePub downloads, according to the available data) and Abstracts Views on Vision4Press platform.
Data correspond to usage on the plateform after 2015. The current usage metrics is available 48-96 hours after online publication and is updated daily on week days.
Initial download of the metrics may take a while.