Open Access
Fig. 9
Download original image
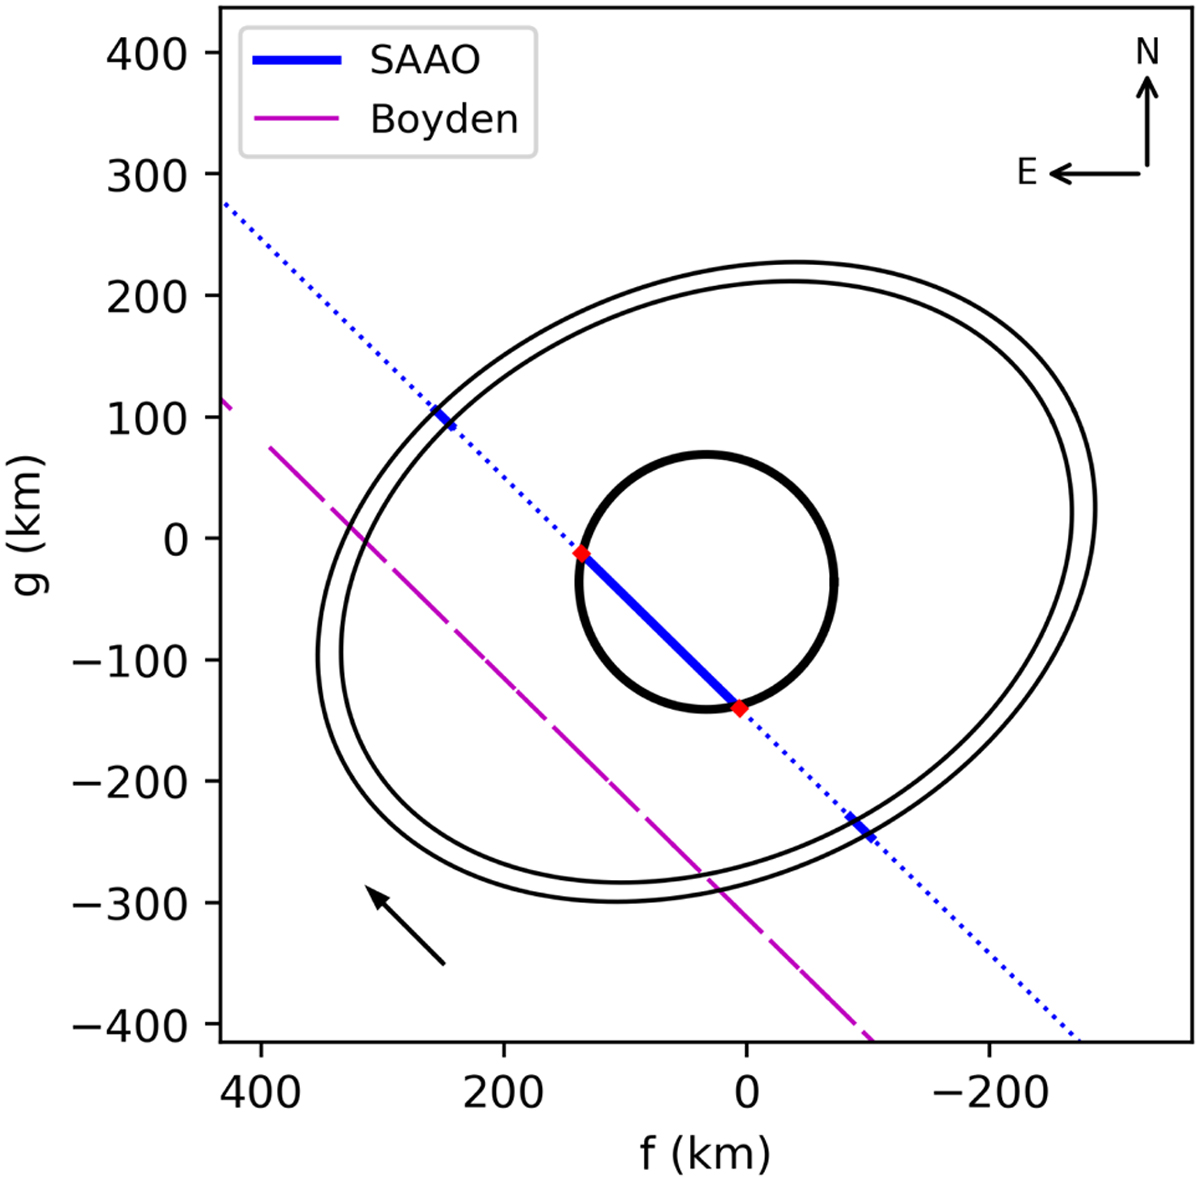
Reconstructed geometry of 2018 event with the rings as proposed by Ortiz et al. (2015). The large blue segment corresponds to the chord detected from SAAO and the small ones are the expected location of the rings. The magenta dashed line corresponds to each exposure from the Boyden observatory negative chord.
Current usage metrics show cumulative count of Article Views (full-text article views including HTML views, PDF and ePub downloads, according to the available data) and Abstracts Views on Vision4Press platform.
Data correspond to usage on the plateform after 2015. The current usage metrics is available 48-96 hours after online publication and is updated daily on week days.
Initial download of the metrics may take a while.