Fig. 7
Download original image
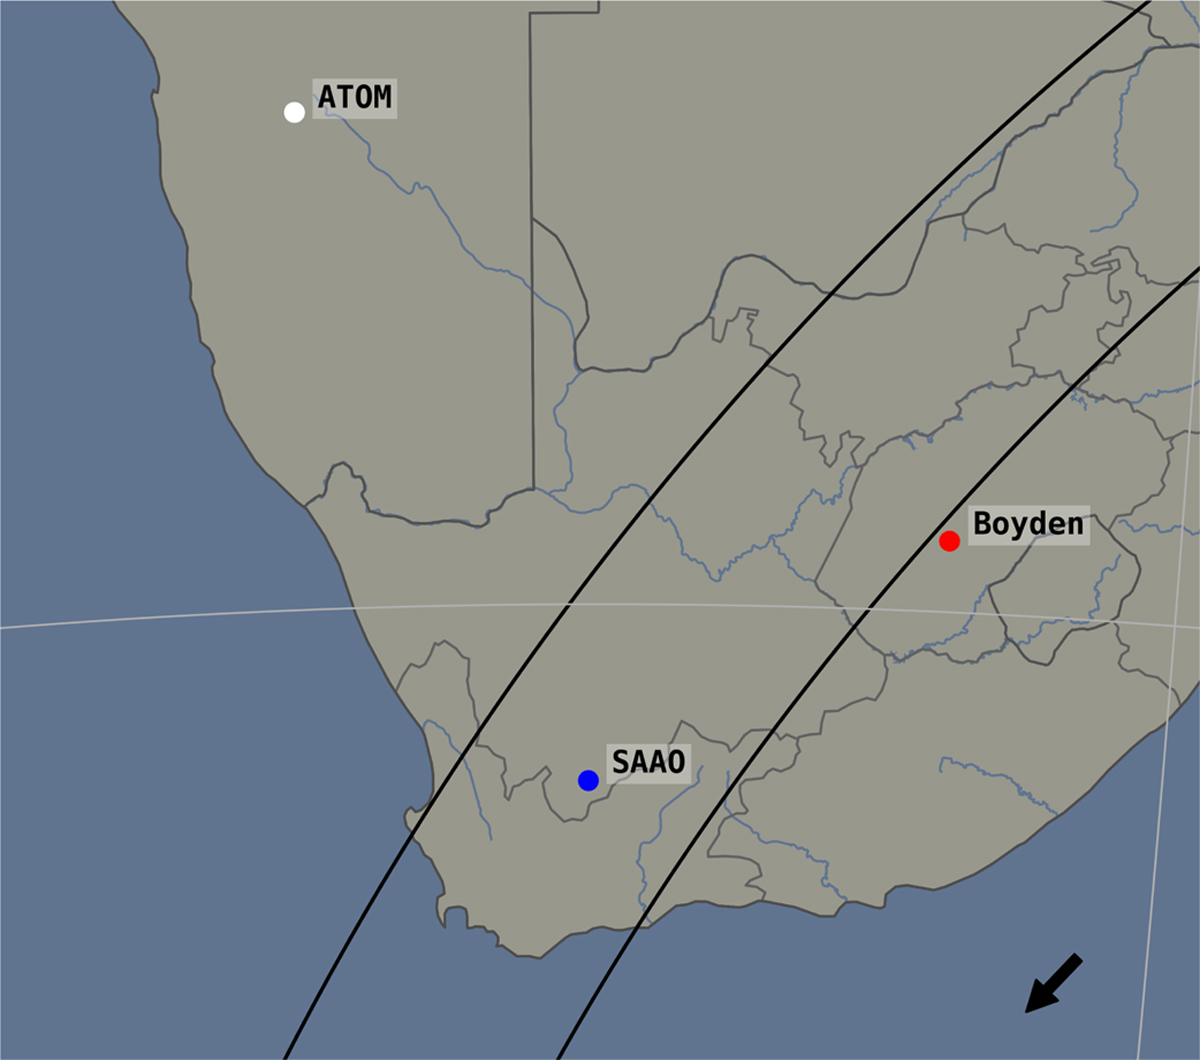
Post-diction map of the November 28, 2018 event. The black lines delineate Chiron’s shadow path, the blue dot is the SAAO site where the occultation was detected, the red dot is Boyden, where data were acquired but no event was detected, and the white dot (ATOM) could only start acquisition after the actual local closest approach.
Current usage metrics show cumulative count of Article Views (full-text article views including HTML views, PDF and ePub downloads, according to the available data) and Abstracts Views on Vision4Press platform.
Data correspond to usage on the plateform after 2015. The current usage metrics is available 48-96 hours after online publication and is updated daily on week days.
Initial download of the metrics may take a while.