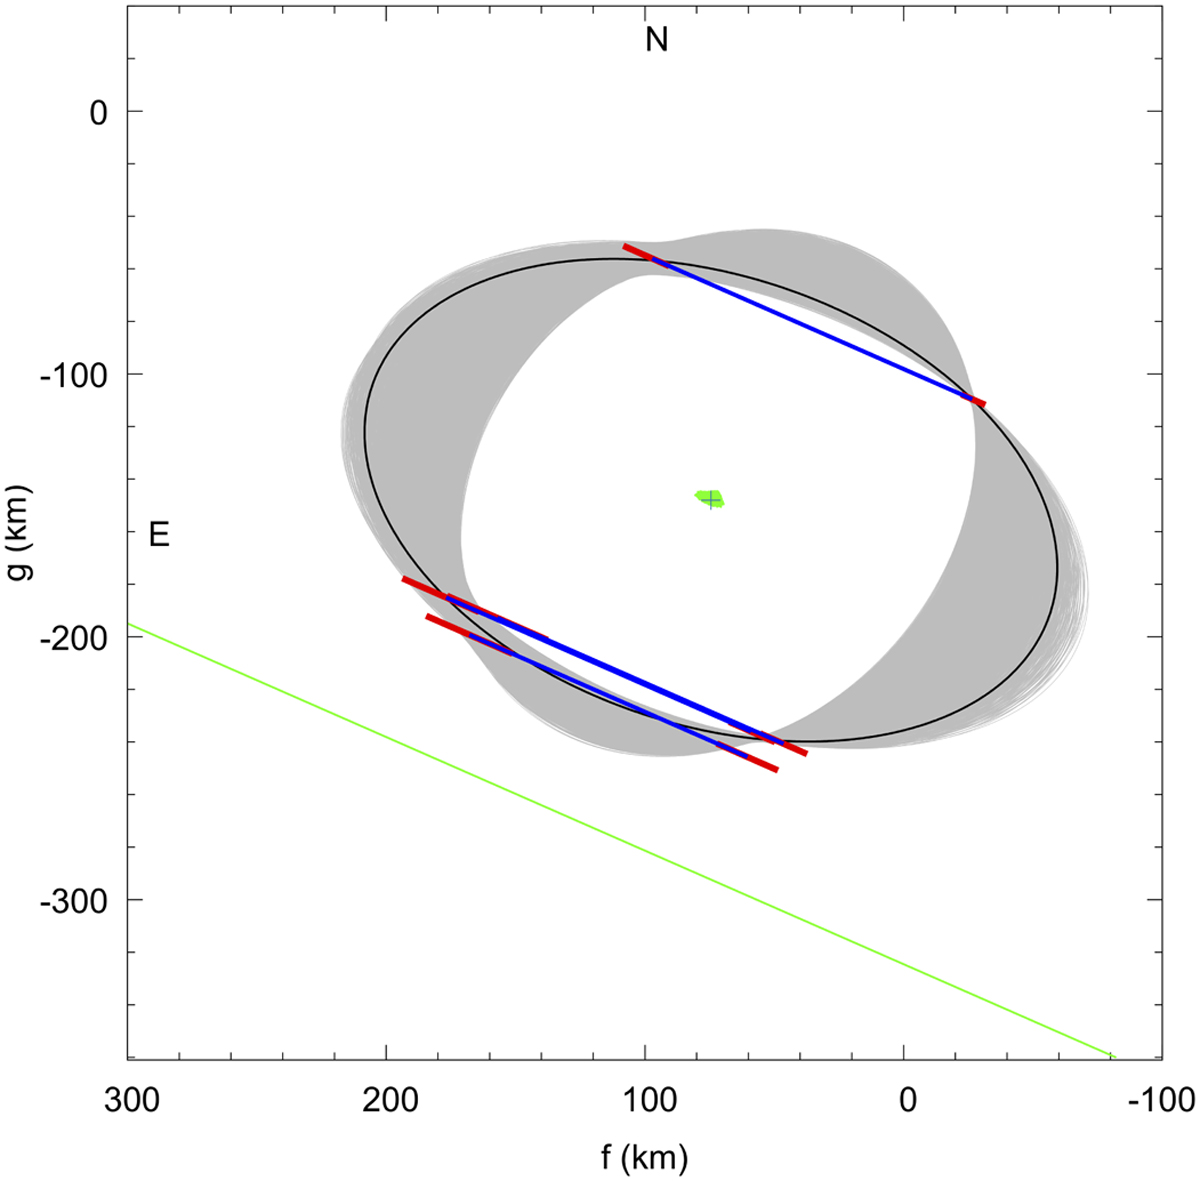
Fig. 4
Download original image
Same as Fig. 2, with the best fitting ellipse plotted in black (e.g., the lowest χ2 value) and the lσ-level ellipse plotted in grey. The green spot in the center of the ellipses represents their respective centers. The Paris chord was shifted forward by 0.9 seconds for the best alignment with the other sites (see text for details). The green line below the ellipses is the negative chord observed from the Forcarei site.
Current usage metrics show cumulative count of Article Views (full-text article views including HTML views, PDF and ePub downloads, according to the available data) and Abstracts Views on Vision4Press platform.
Data correspond to usage on the plateform after 2015. The current usage metrics is available 48-96 hours after online publication and is updated daily on week days.
Initial download of the metrics may take a while.