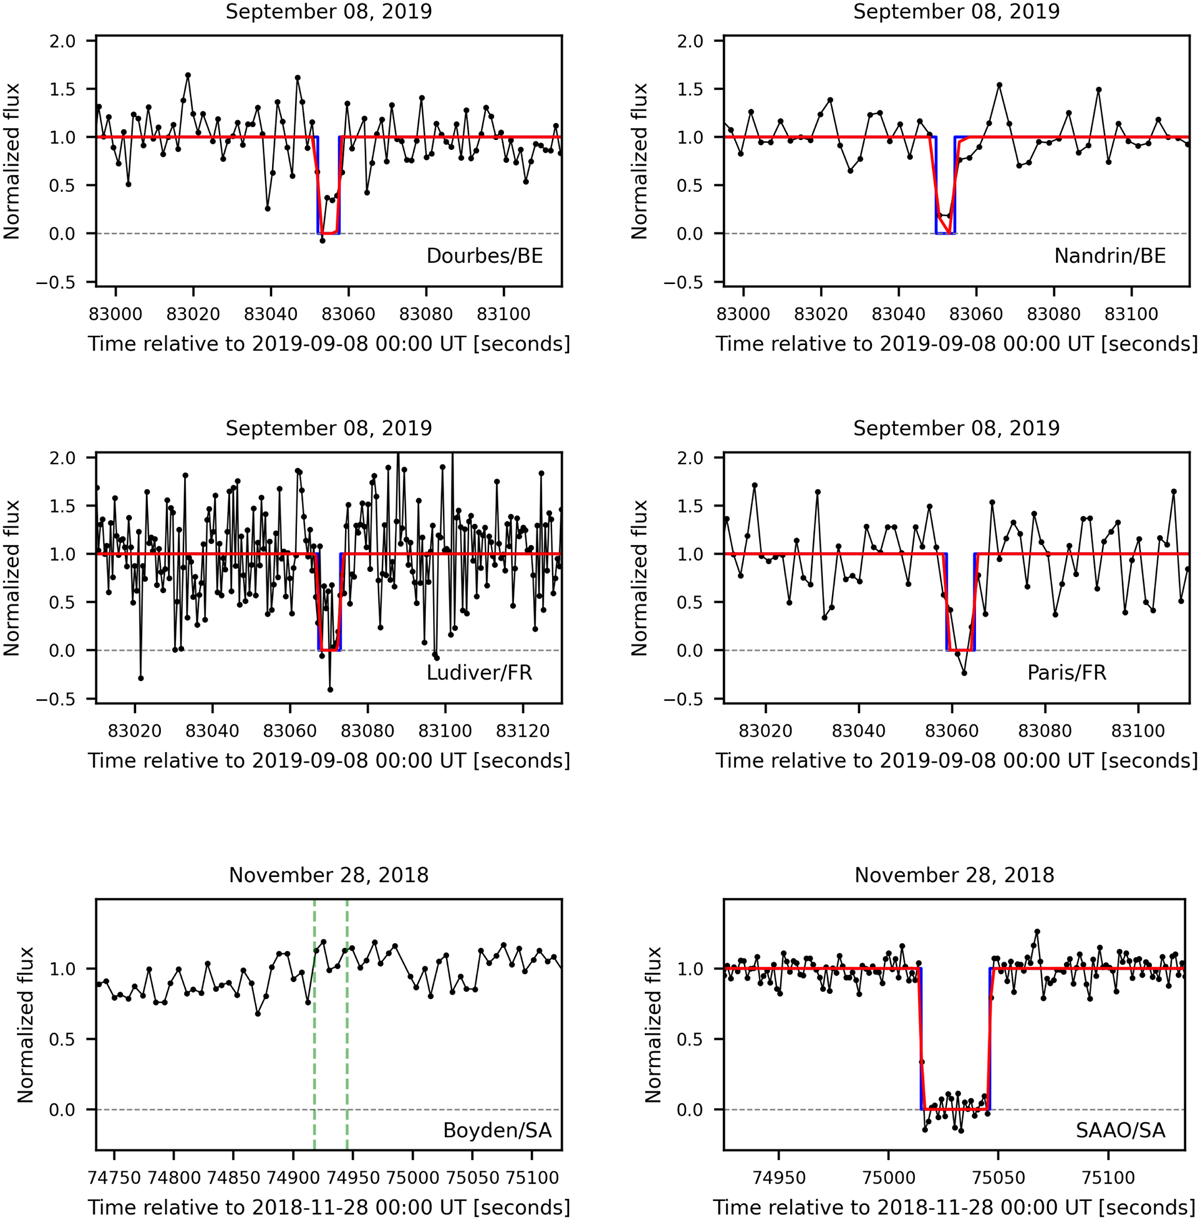
Fig. A.1
Download original image
Black lines and dots are the data obtained from each site, the blue lines the opaque band, and red lines the modeled light curve, convoluted to the exposure time. Times are given in seconds after midnight of the event date. The site names are given in each panel. The green vertical dashed lines on Boyden’s panel indicate the theoretical ingress and egress times.
Current usage metrics show cumulative count of Article Views (full-text article views including HTML views, PDF and ePub downloads, according to the available data) and Abstracts Views on Vision4Press platform.
Data correspond to usage on the plateform after 2015. The current usage metrics is available 48-96 hours after online publication and is updated daily on week days.
Initial download of the metrics may take a while.